


The Benefit-&-Effort-Matrix is used to systematically evaluate and compare measures or projects in terms of their benefits (Benefit) and the required effort (Effort). The matrix is visually structured so that a decision can be quickly made in management.
You can download the data here: Projektselection.atb (AlphadiTab v1.2.1 required)
In a project selection, three potential projects were compared. Management should decide which projects should be carried out and which should not.
Projects:
Result:
Project 1 is in the blue area, so it should be carried out.
Project 2 is in the yellow area, it is a management decision.
Project 3 is in the green area, it should be carried out.
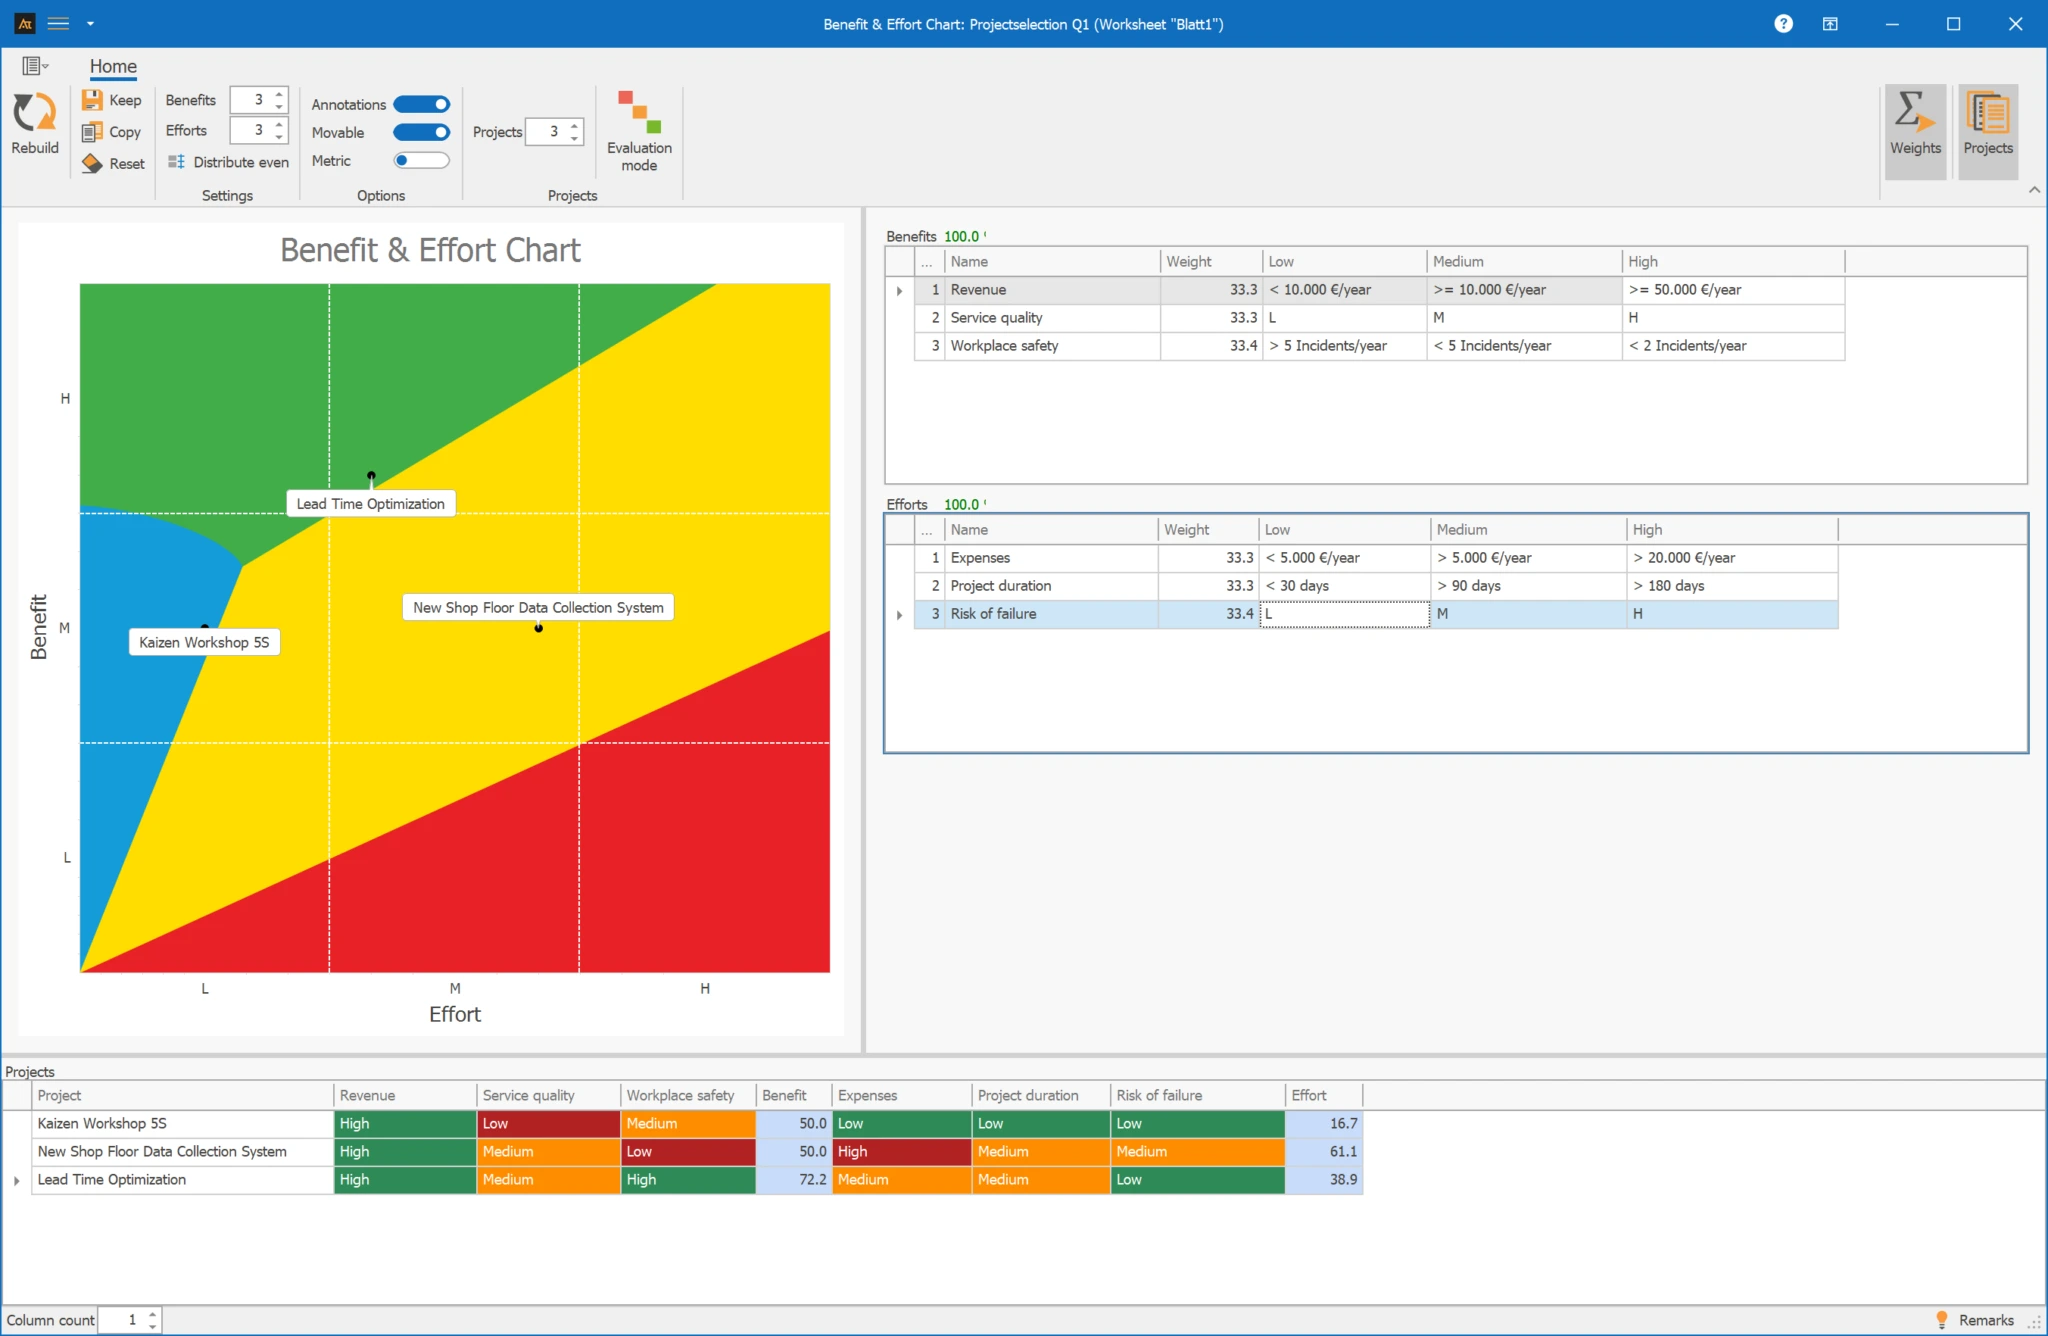
Explanations for the graphic:
- Blue area: (Quick Hit or quick solution): Medium benefit with low effort. This should be prioritized for implementation. These are projects that can usually be carried out in a few days or weeks with low risk.
- Green area: High benefit with low or medium effort. These are projects that may take a little longer, usually 3–6 months, and where the risk of failure is low. These should be planned and carried out.
- Yellow area: What you put in is what you get out. Further evaluation can be carried out or it is decided by management as an investment for the future.
- Red area: The effort is high in relation to the benefit. Such measures or projects should be avoided.
Select the B-&-E-Matrix tool (if applicable in the Improve phase). After the first start of the tool, the benefits and efforts can be seen on the right side in two tables. These are preset. The number of rows can be expanded with this setting: 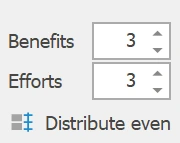

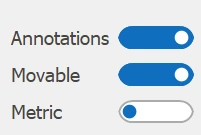
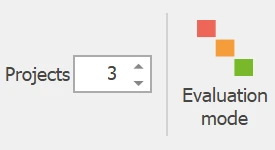
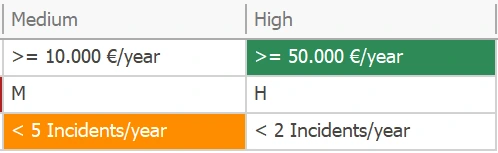
For a meaningful analysis, it is important that all considered measures are clearly described and distinguishable from each other. Only then can a comparable evaluation take place. Additionally, benefits and efforts should be assessed according to uniform criteria to avoid subjective distortions and ensure consistent prioritization. A clear evaluation logic forms the basis for ensuring that the results are comprehensible and reliable.
- Clearly defined measures or projects
- Uniform evaluation basis
Benefit: Expected added value of a measure
Effort: Required resources for implementation
Quick Hit: Measure with high benefit and low effort