AlphadiTab is a software for solving complex problems that guides you along the DMAIC roadmap from definition through analysis to sustainable improvement.
Every hour your team spends on isolated tools and copy-paste is one hour too many – AlphadiTab gives your team that time back, at a low license cost.
With AlphadiTab, the same budget reaches not just a single specialist but an entire team. For €3,000/year you can already equip 10 users – and anchor methodology knowledge more broadly across the organization.
AlphadiTab is installed locally and runs entirely on your own infrastructure – whether as a standalone install or via an in-house server. Your data stays internal, where it belongs.
All terminology in the analyses and the menu is fully localized. Users can also customize the translations individually in every language.
Whether quality assurance, production, sales, logistics or engineering: AlphadiTab helps teams evaluate data faster, make relationships visible, and prepare decisions — without building every chart, template or calculation from scratch.
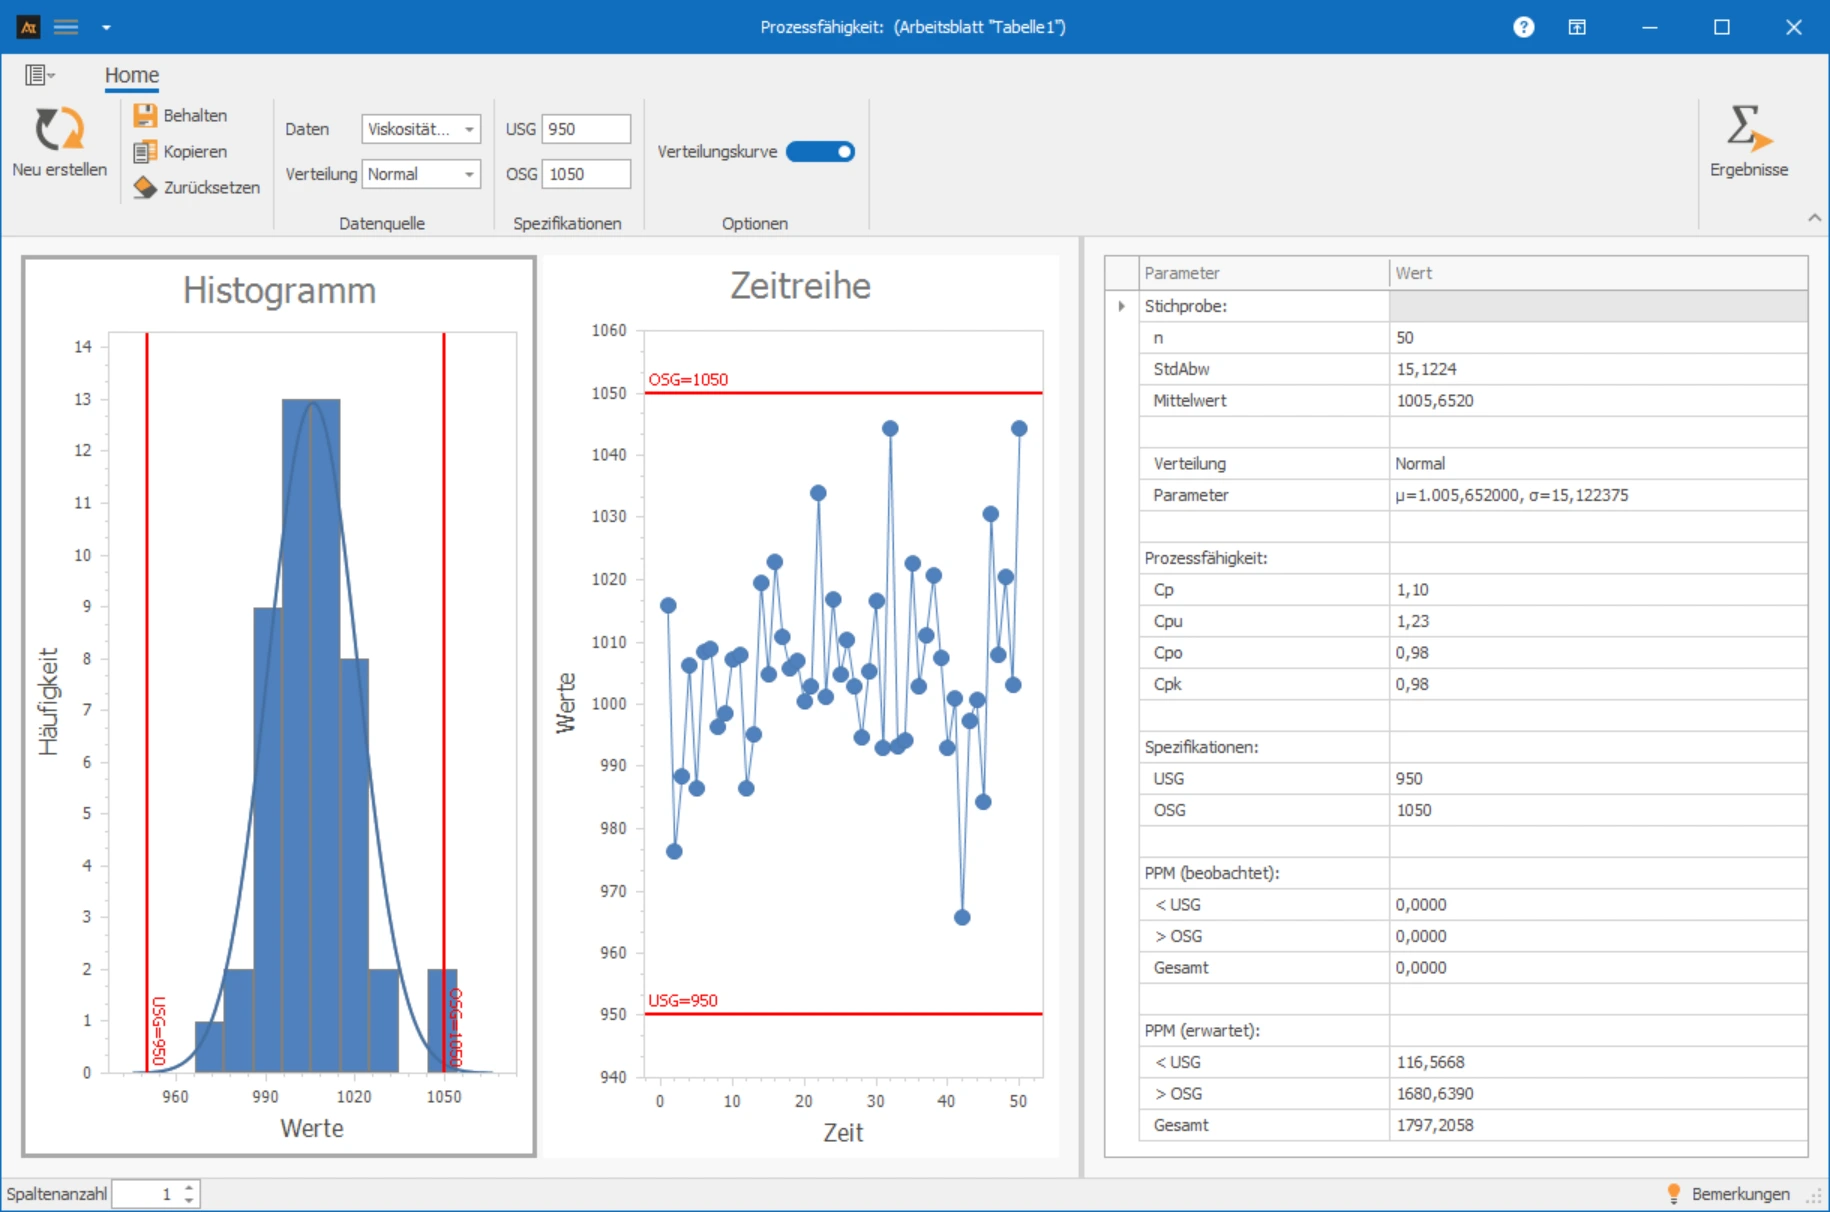
Cp, Cpk and process sigma make visible how reliably a process meets specifications — a foundation for sound quality decisions.
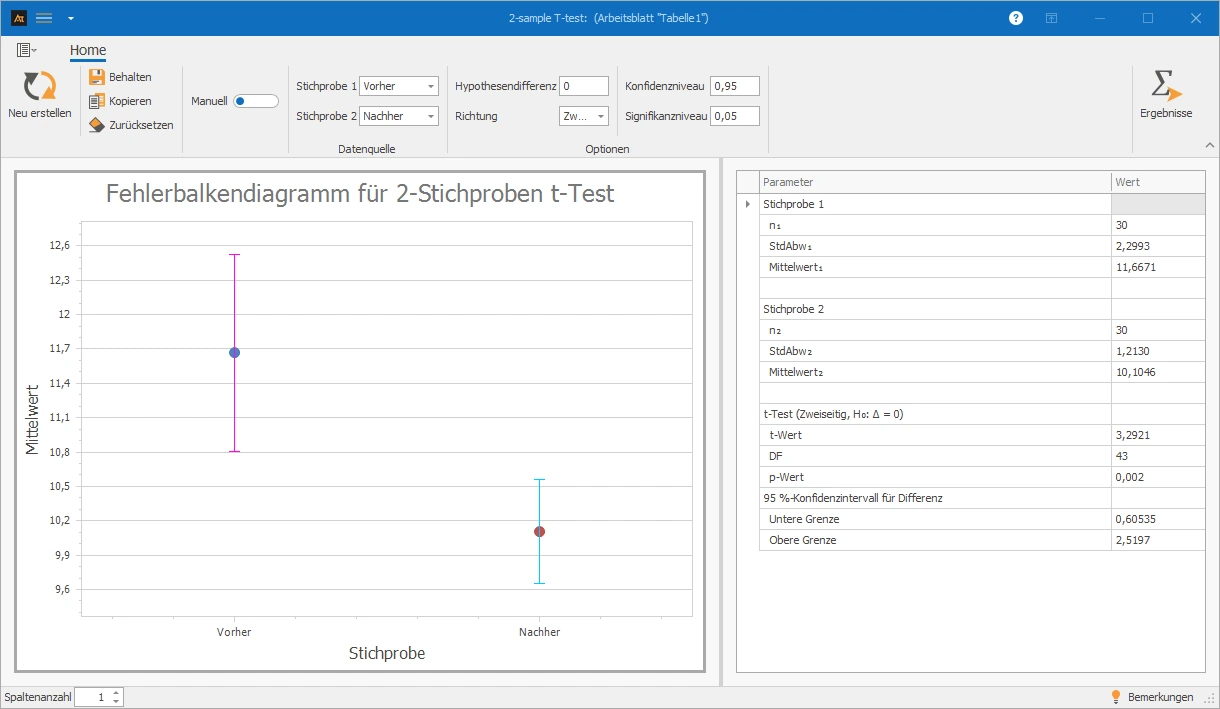
A t-test helps assess whether the average delivery time deviates significantly from the target — and whether action is actually needed.
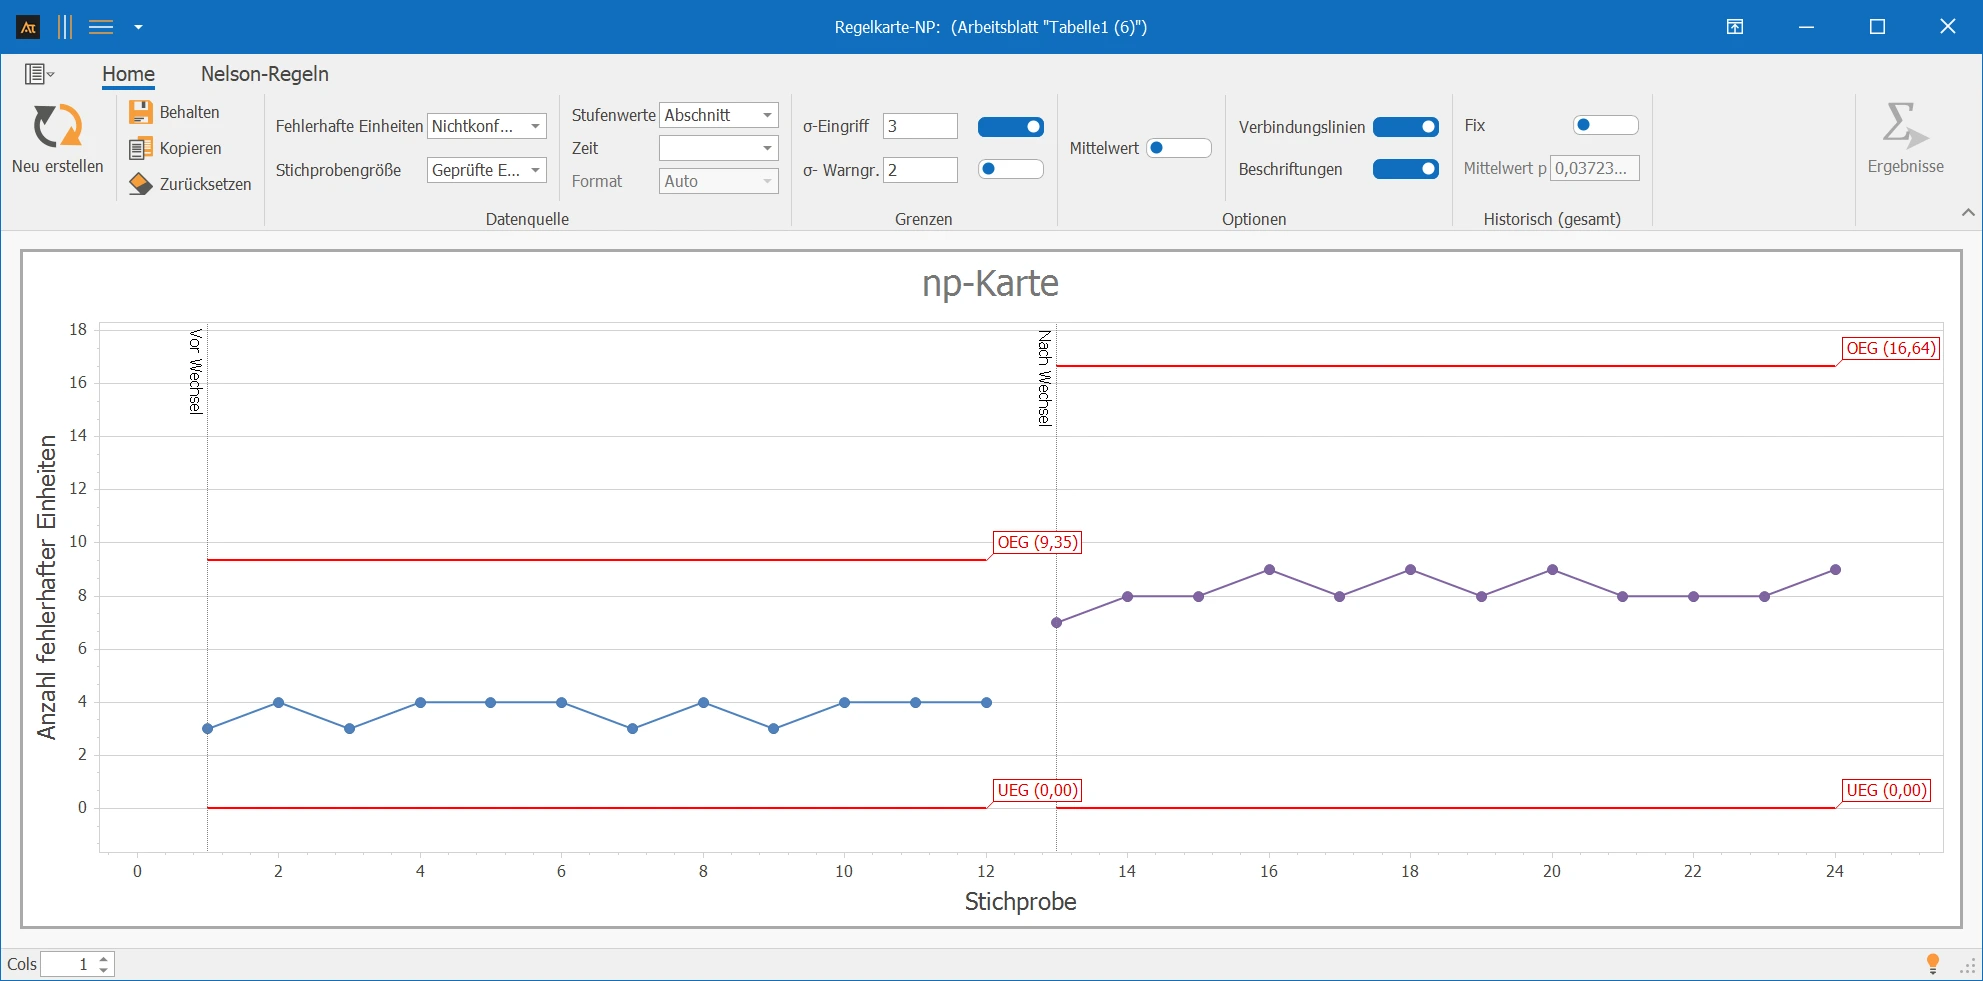
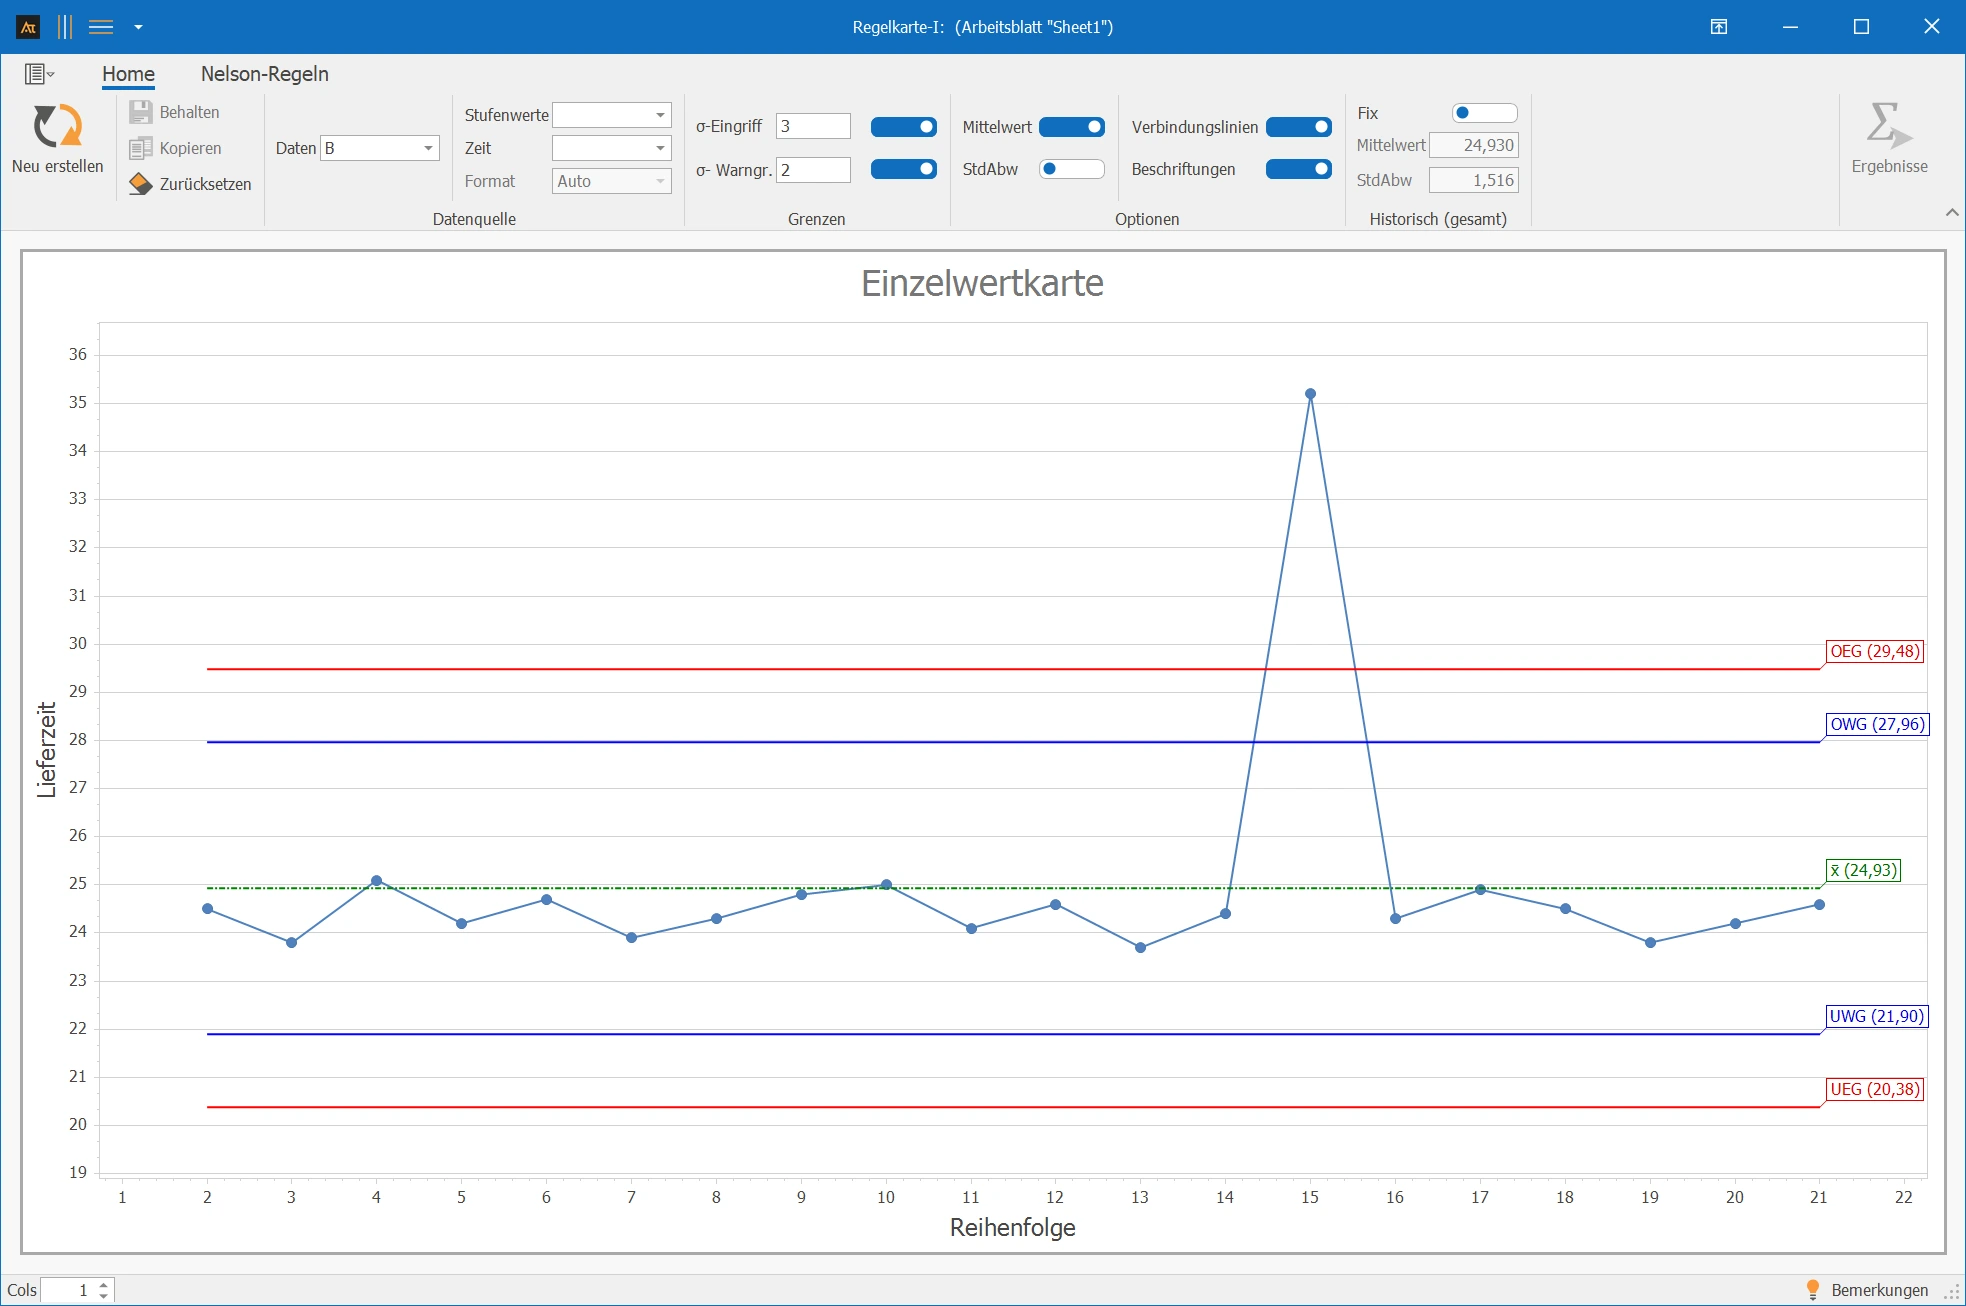
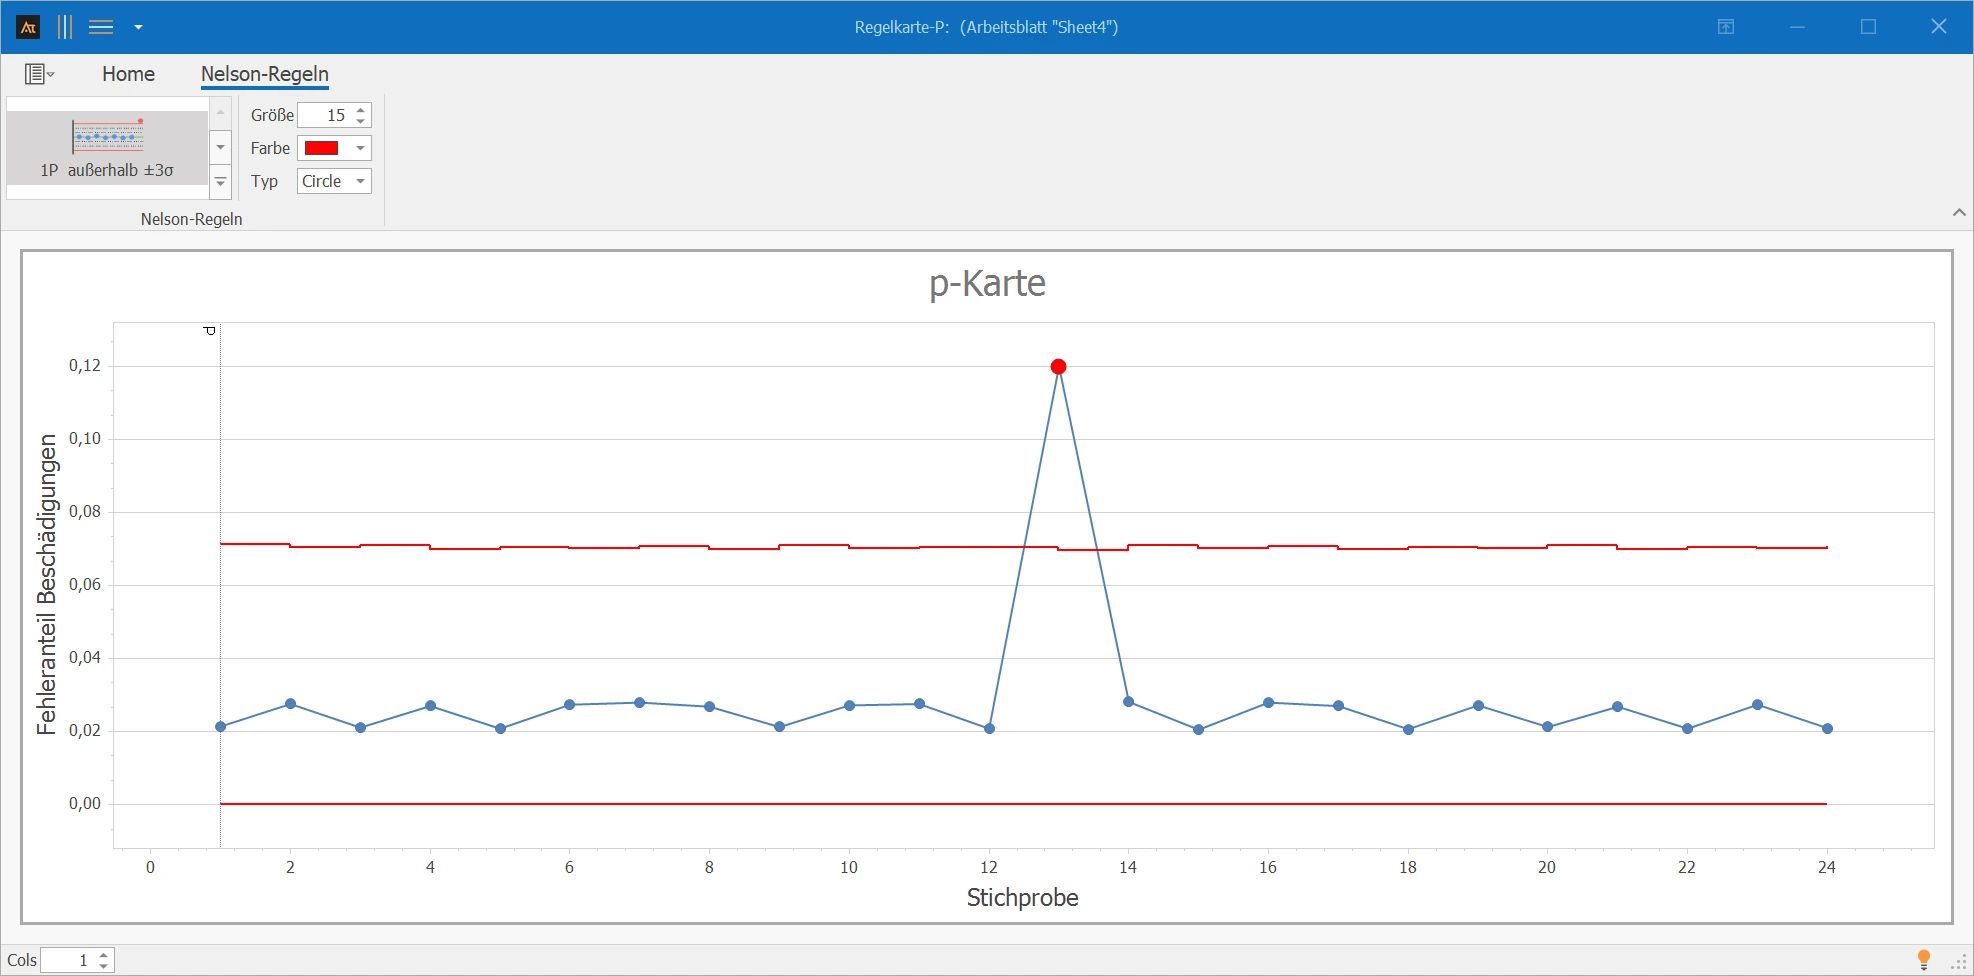
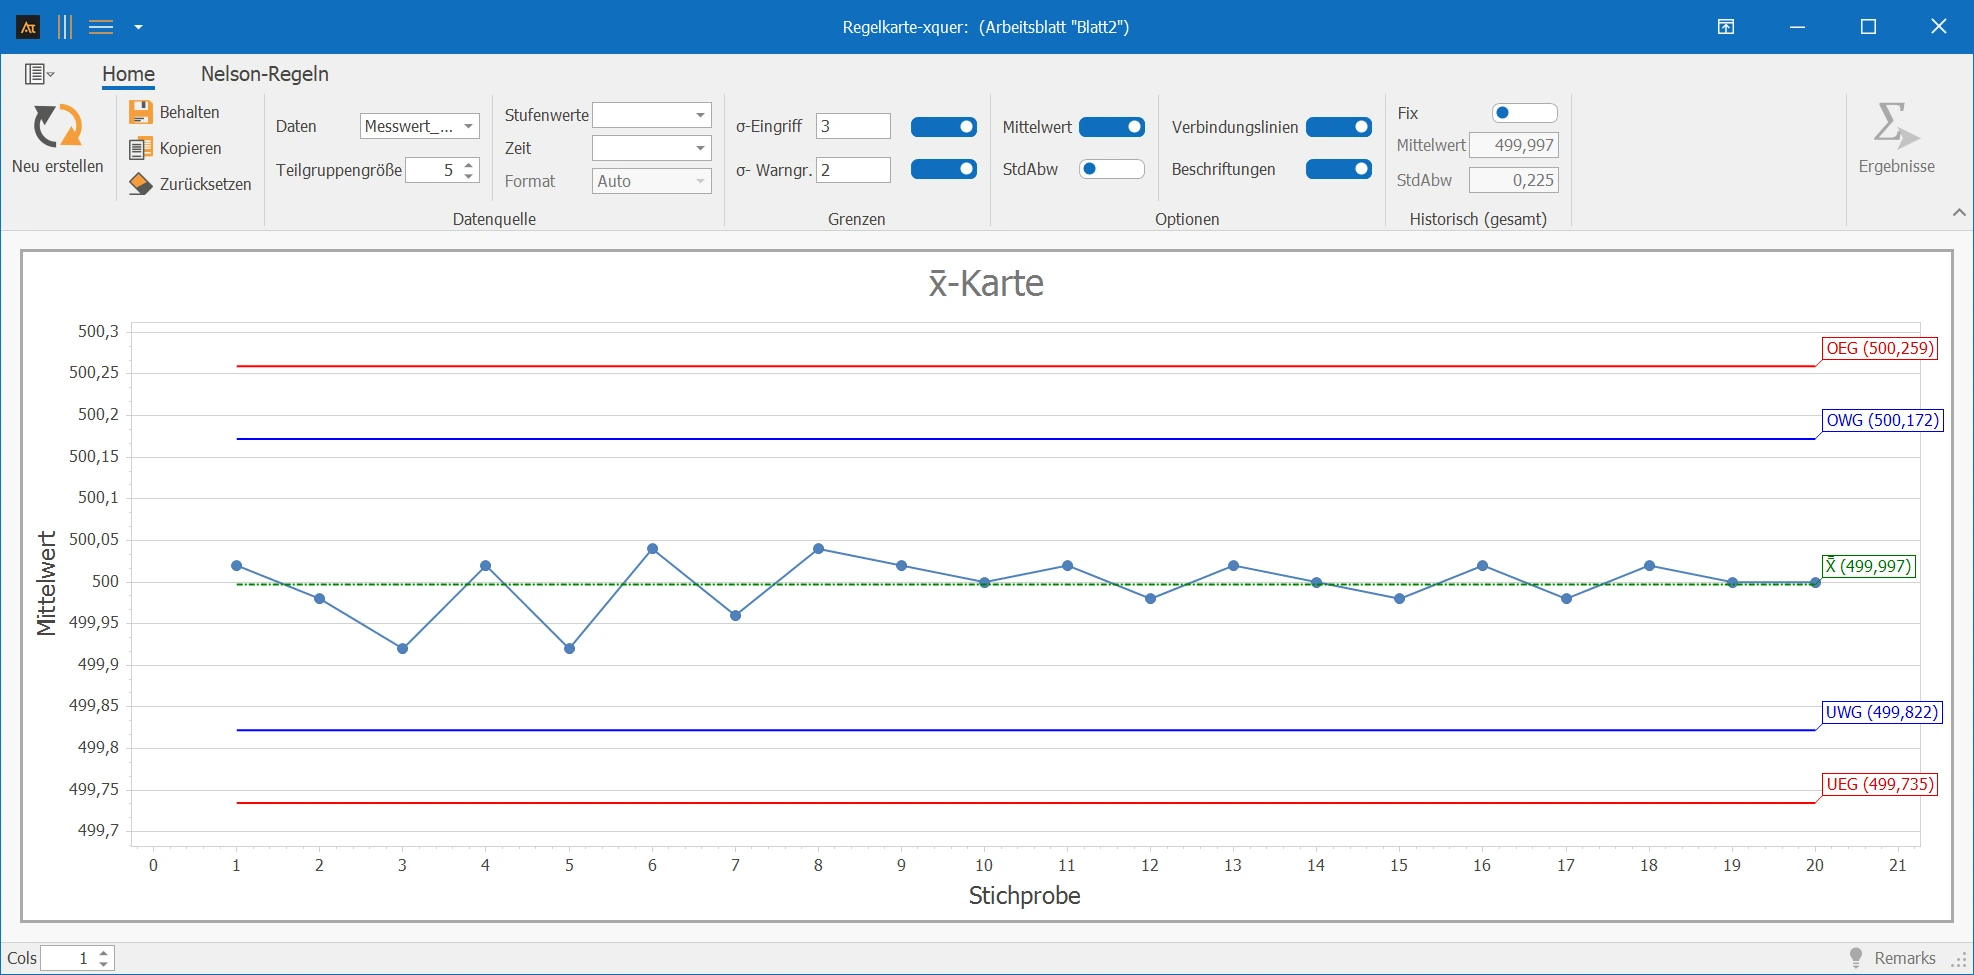
SPC control charts show when a process is truly out of control — and when variation is normal. This helps teams avoid unnecessary interventions, reduce downtime and gain production time.
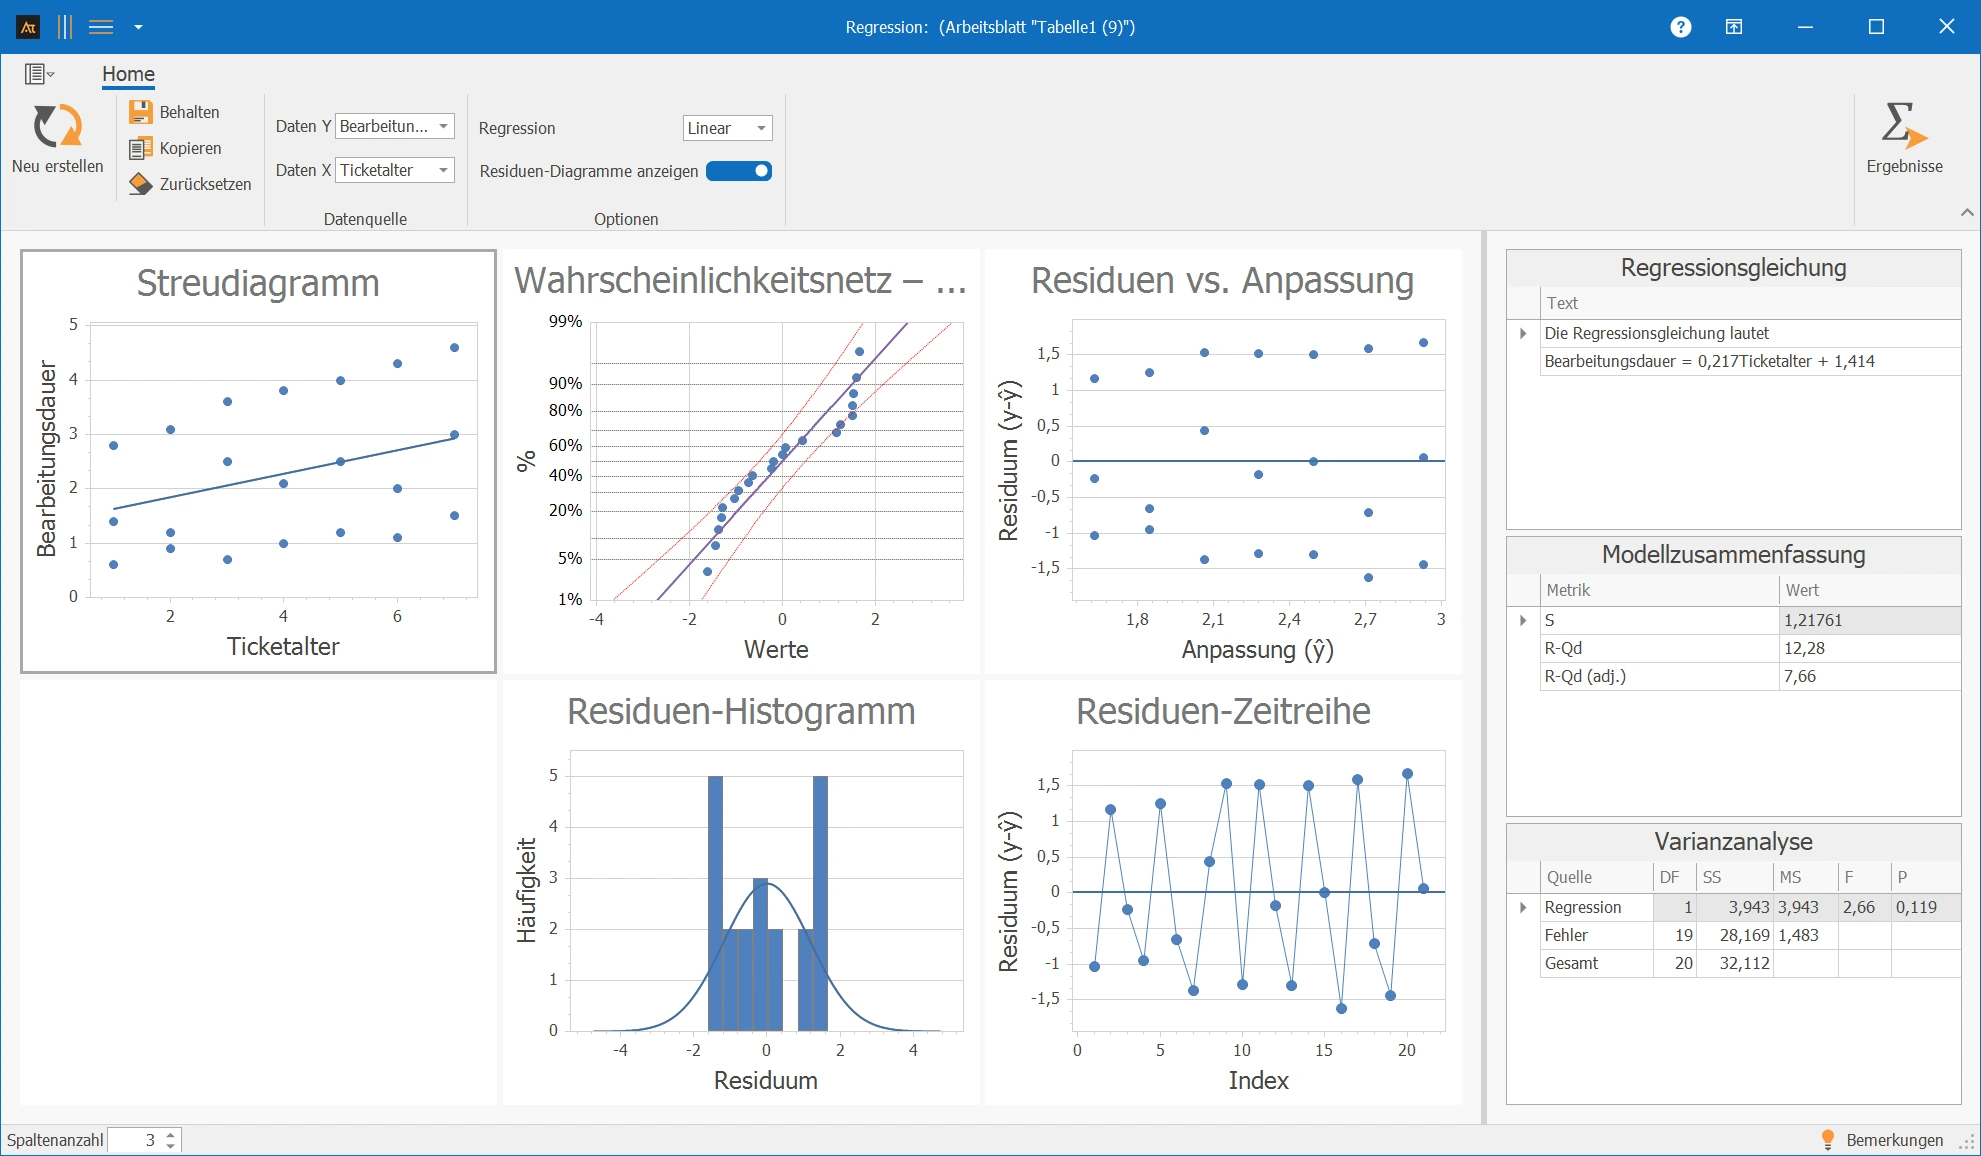
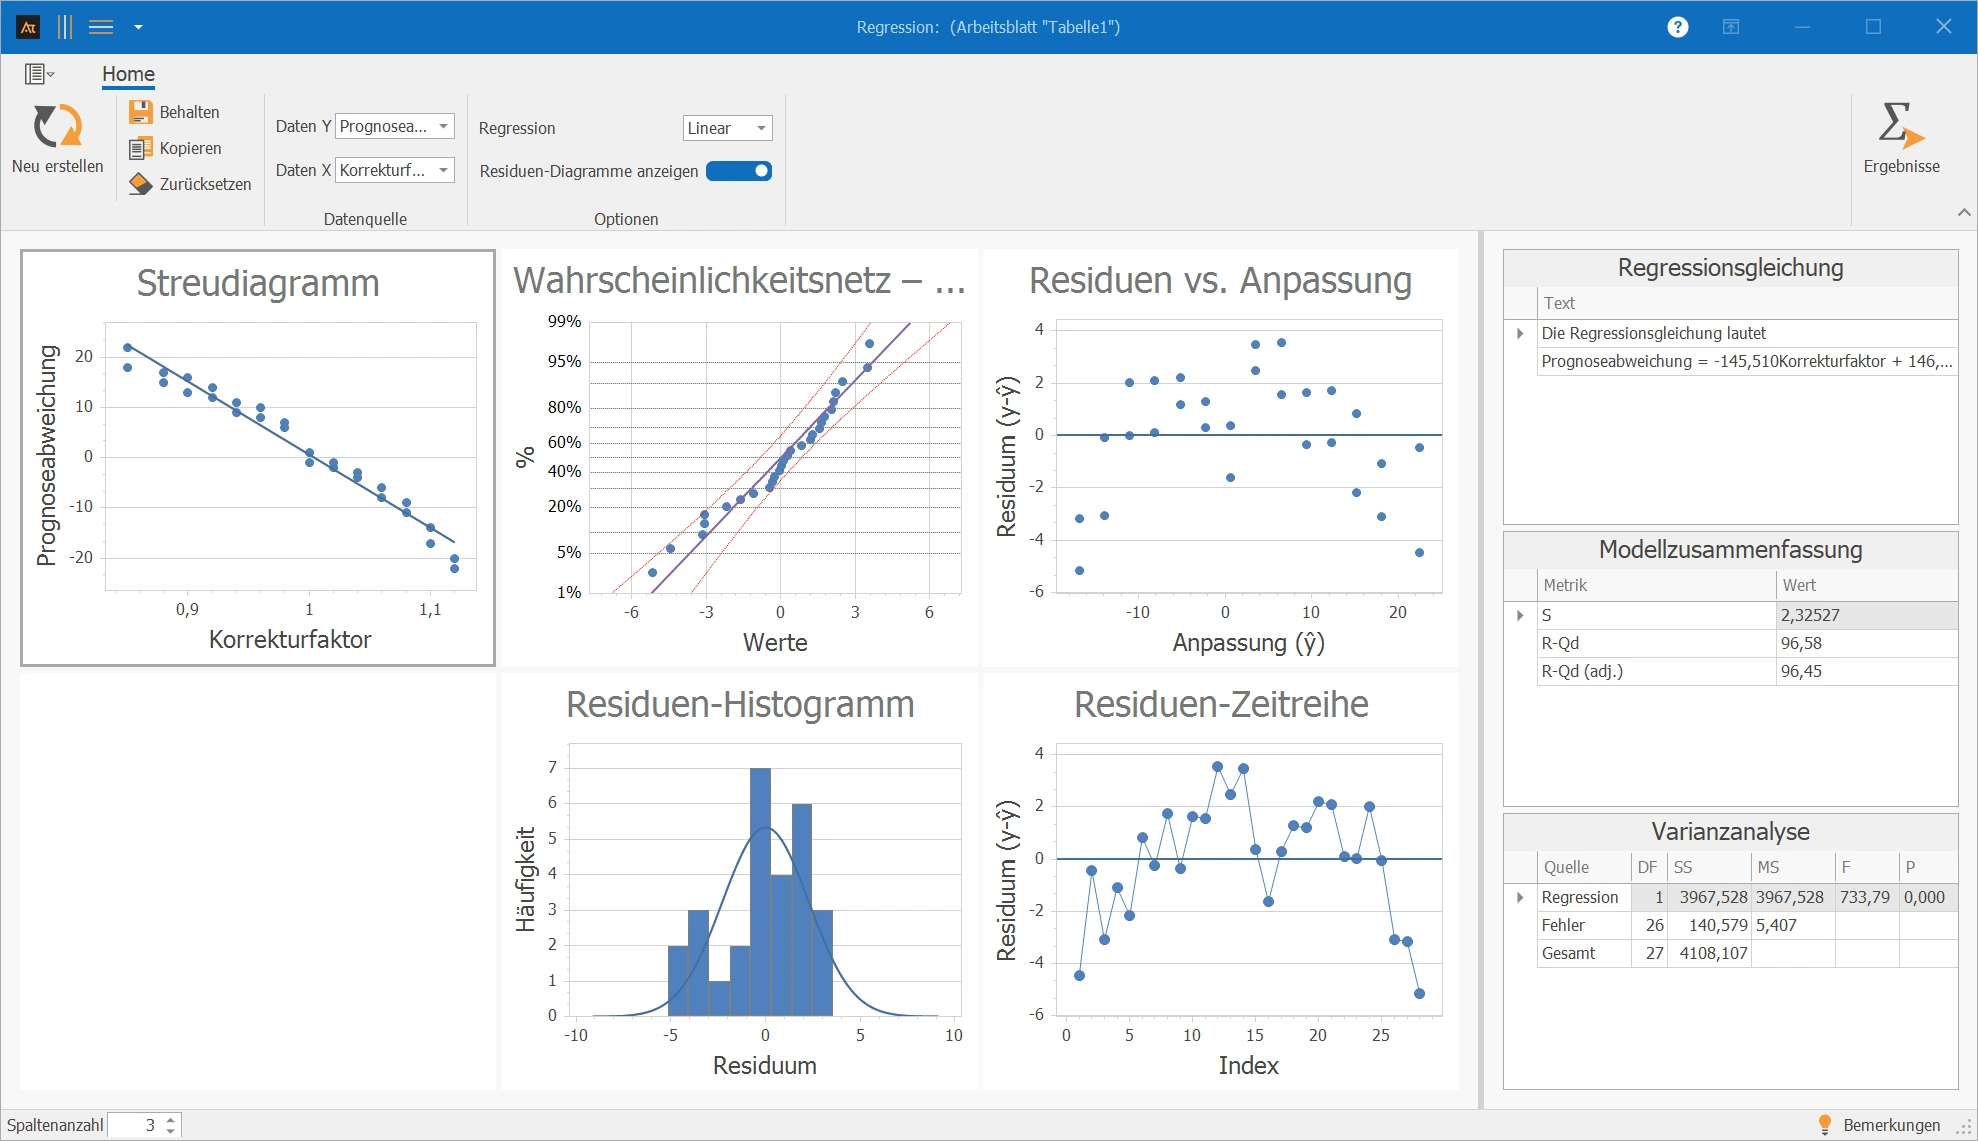
Regression helps identify which factors influence response times — for example ticket volume, priority, time of day or workload. This allows capacity to be planned more precisely.
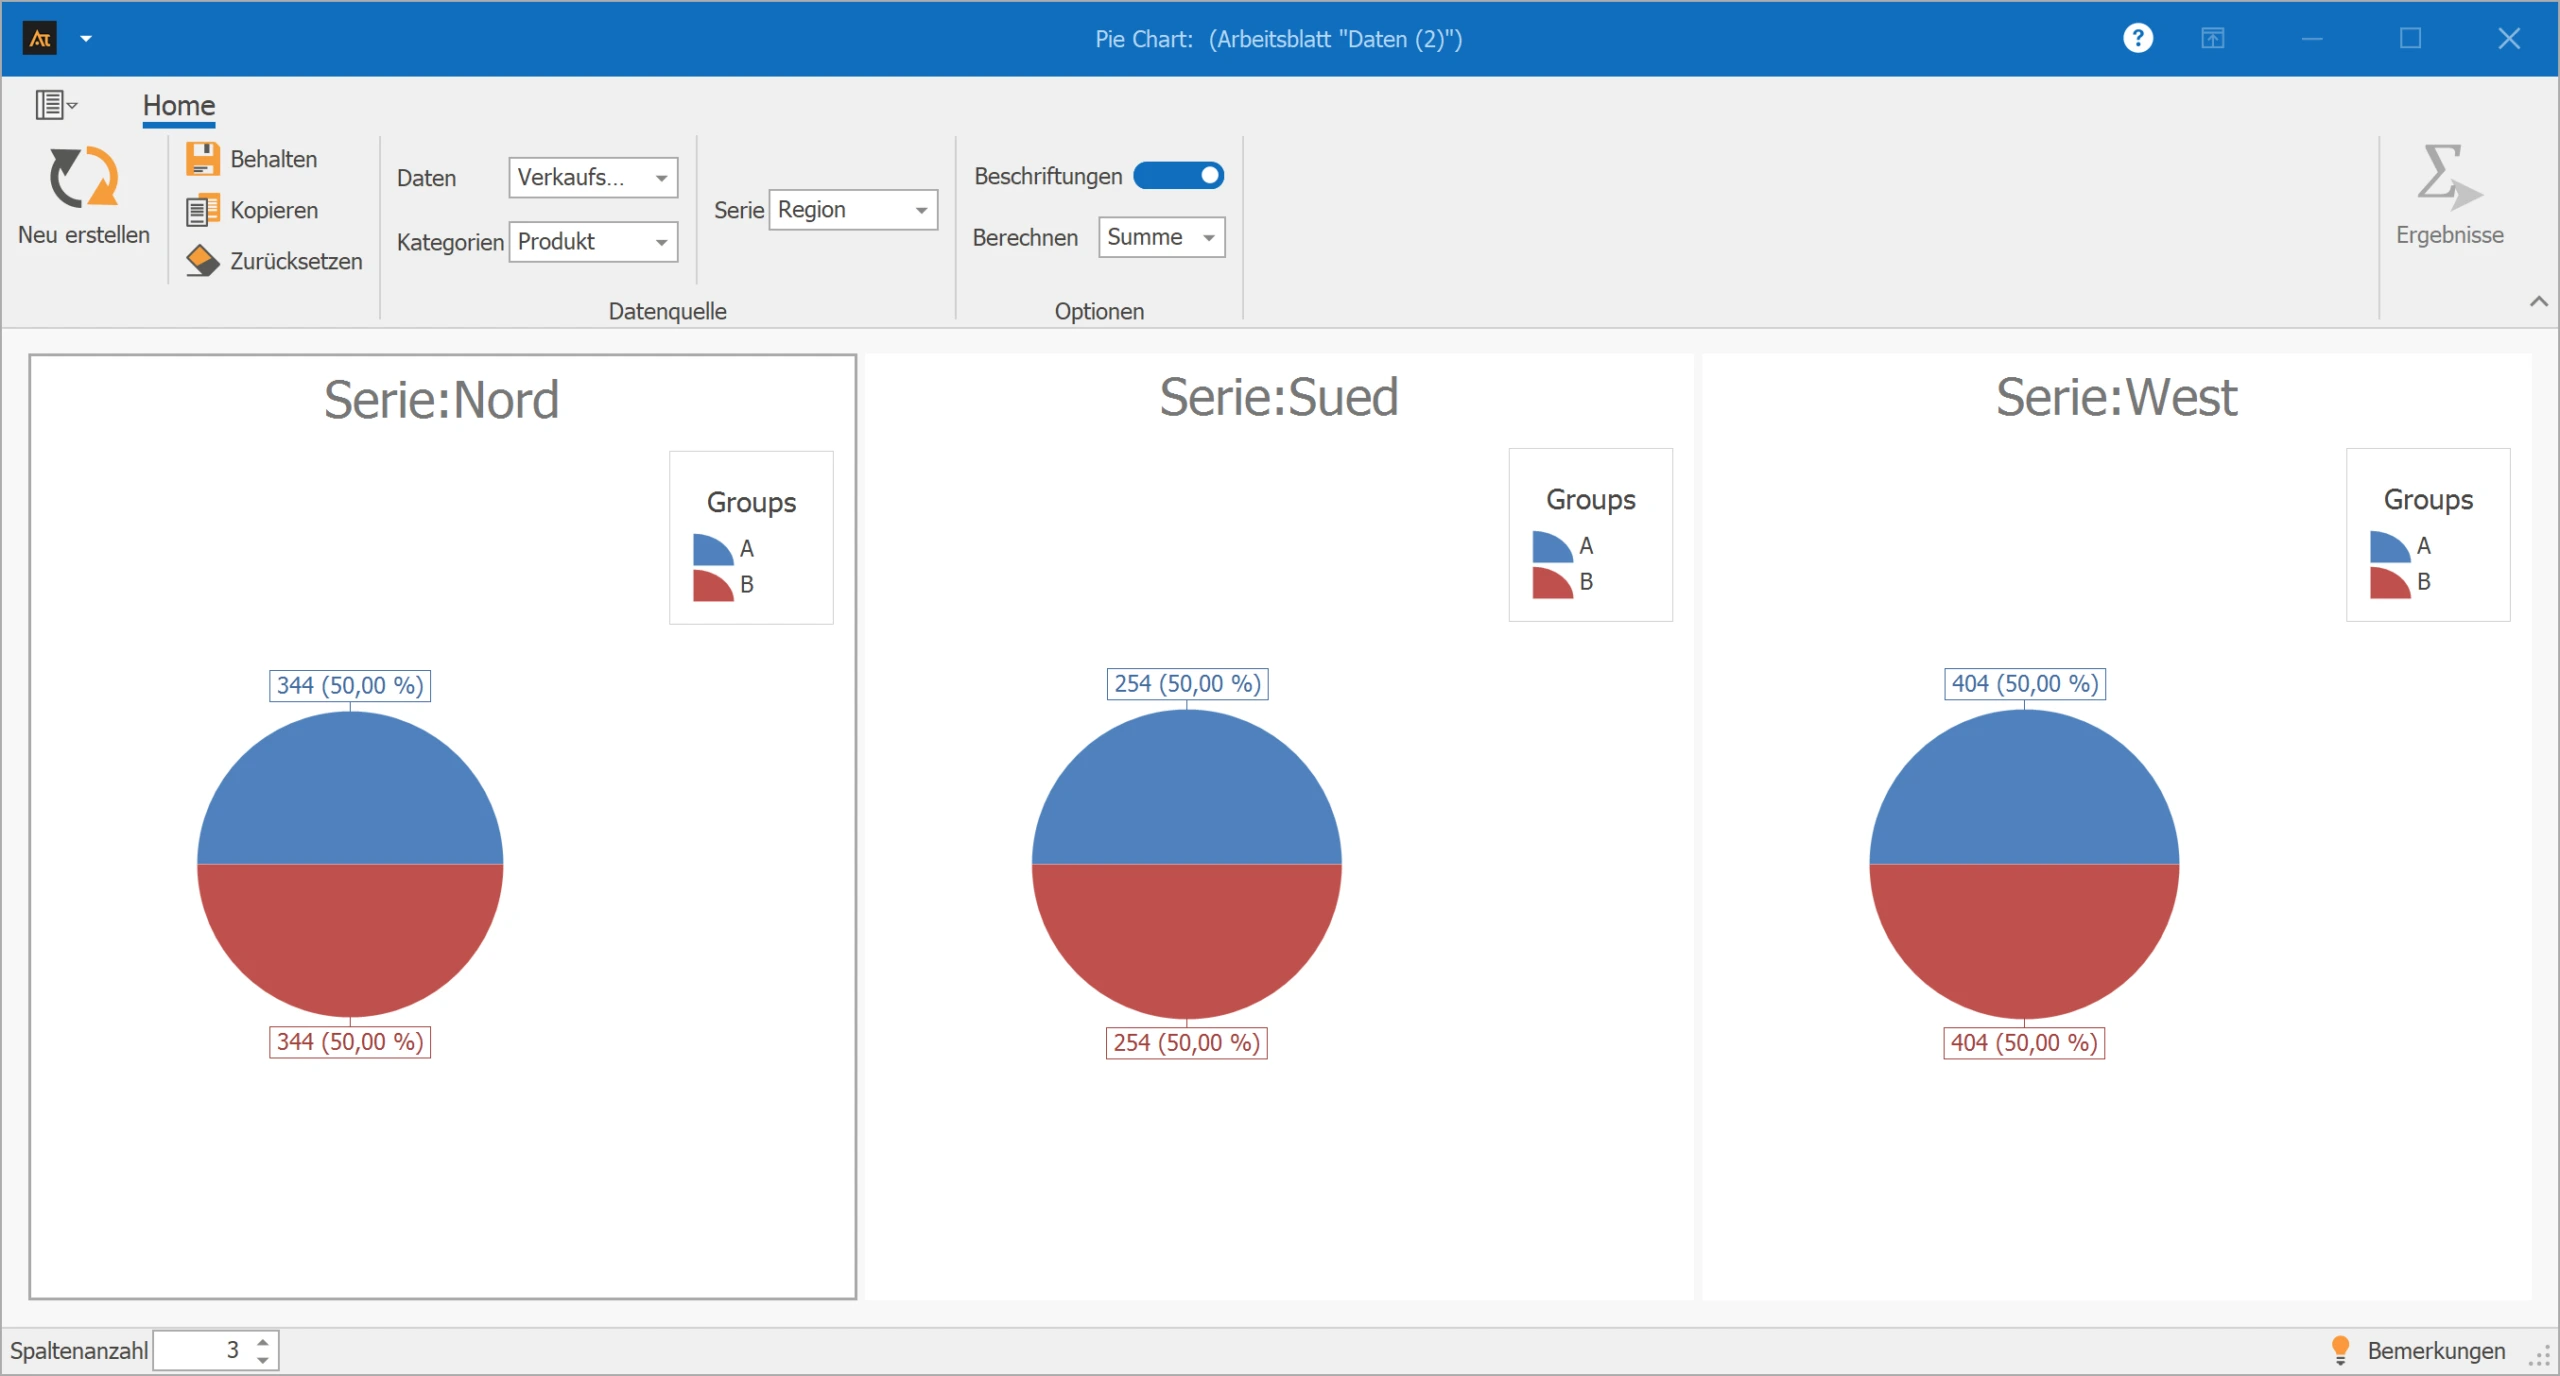
A pie chart visualizes which regions account for the largest share of sales volume. This makes priorities, dependencies and potential in sales visible faster.
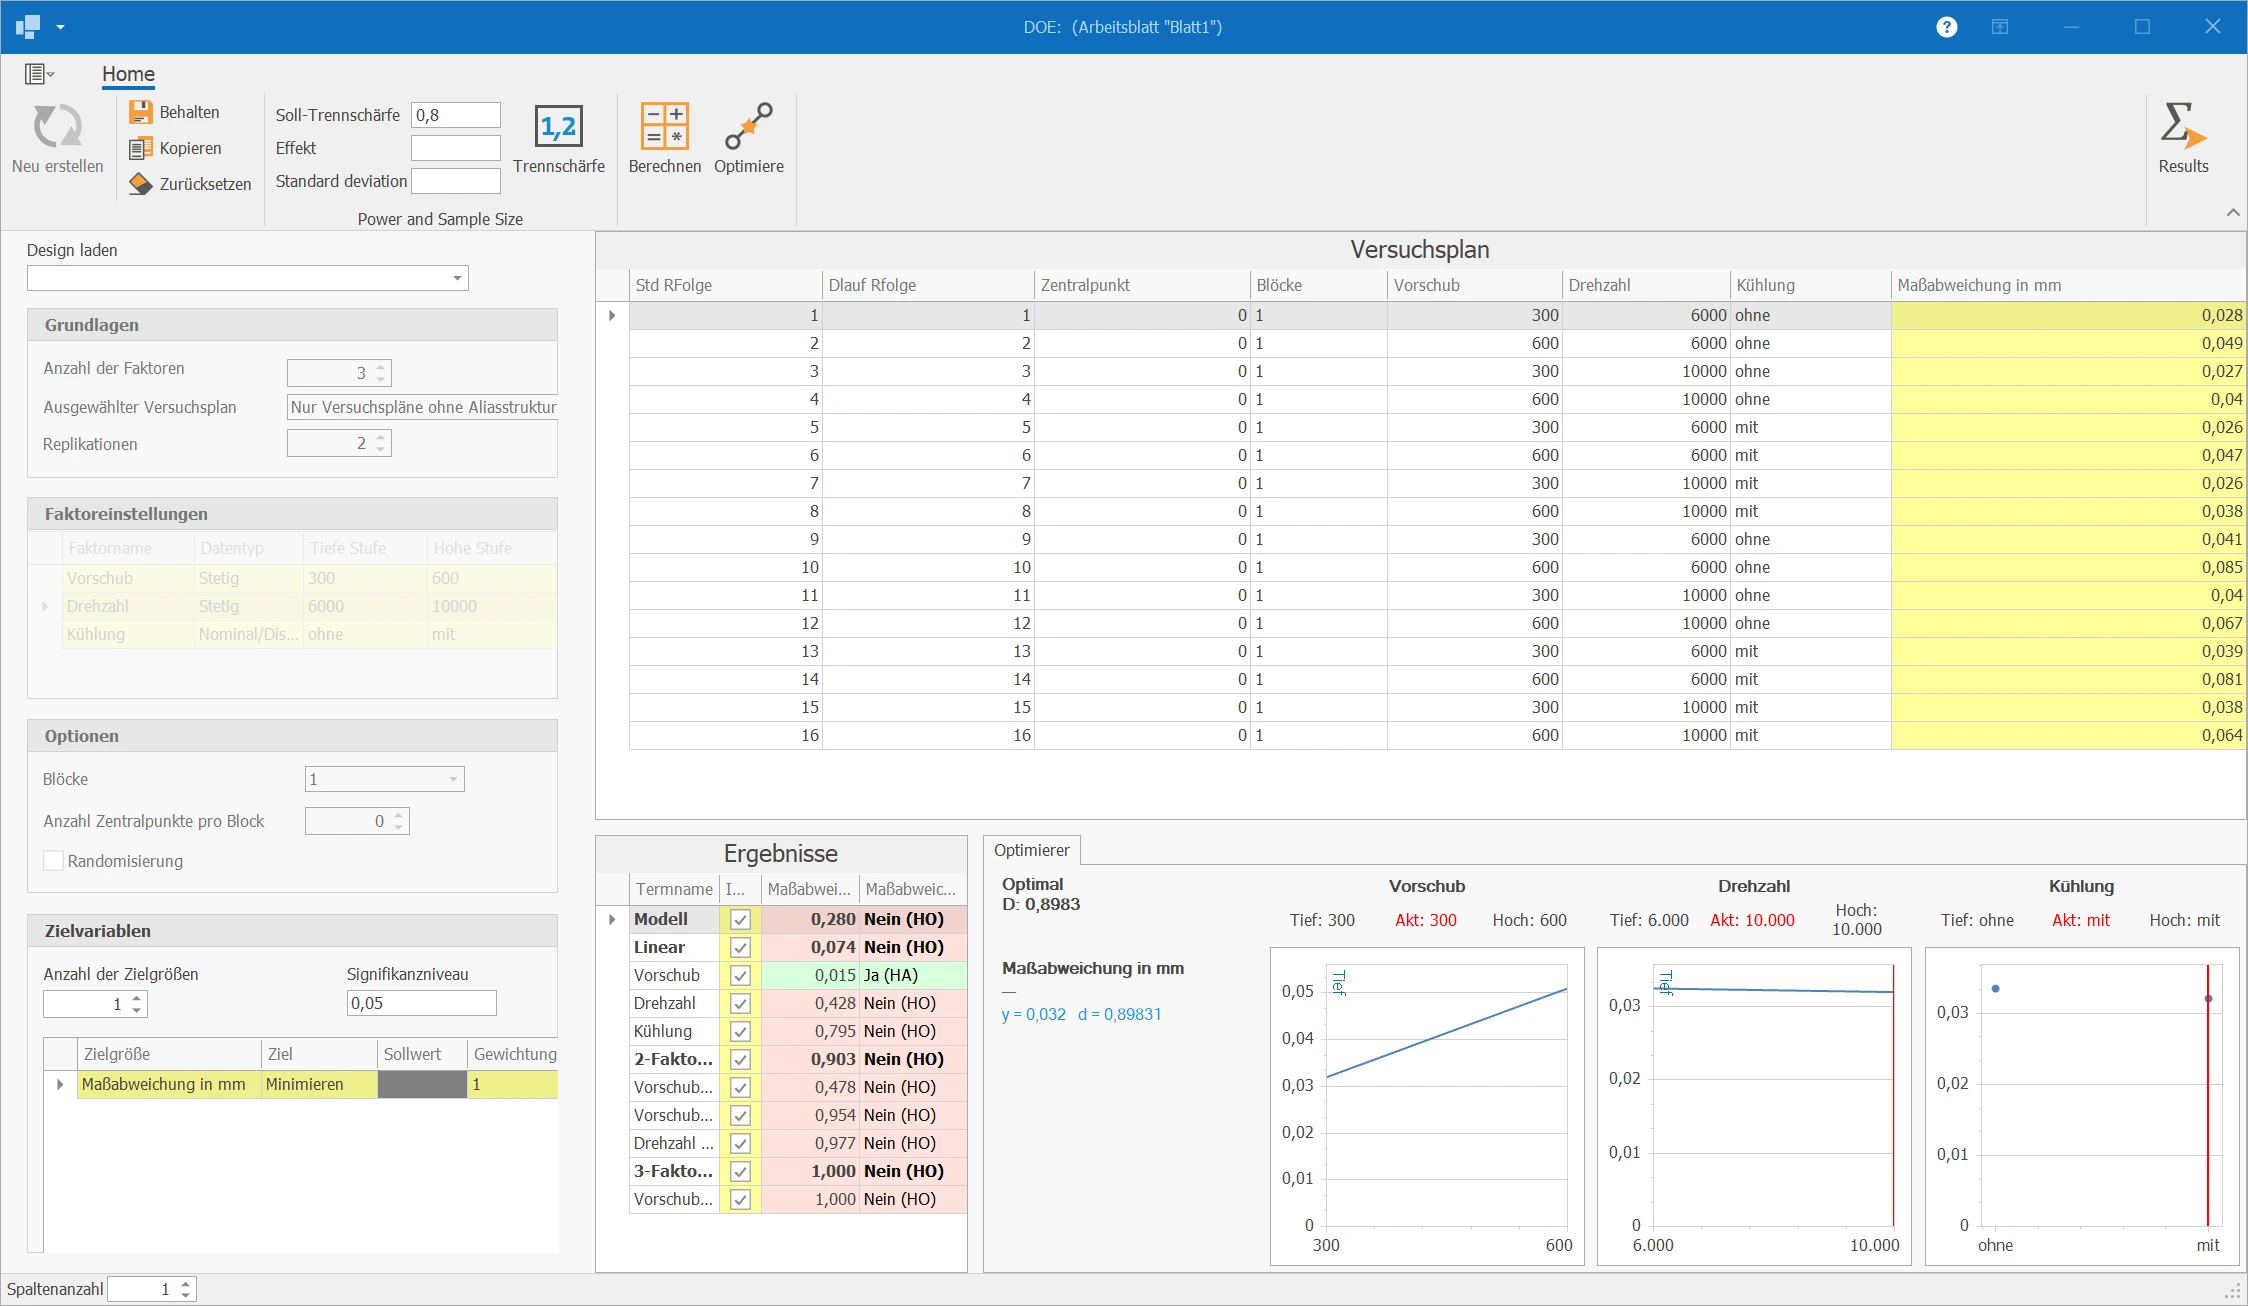
DOE helps systematically investigate influencing factors such as feed rate, speed or cooling. This lets teams derive better settings for quality, cycle time or scrap.
DMAIC is the core methodology of Lean Six Sigma — a structured problem-solving process in five phases. AlphadiTab guides you through every phase with the right tools.
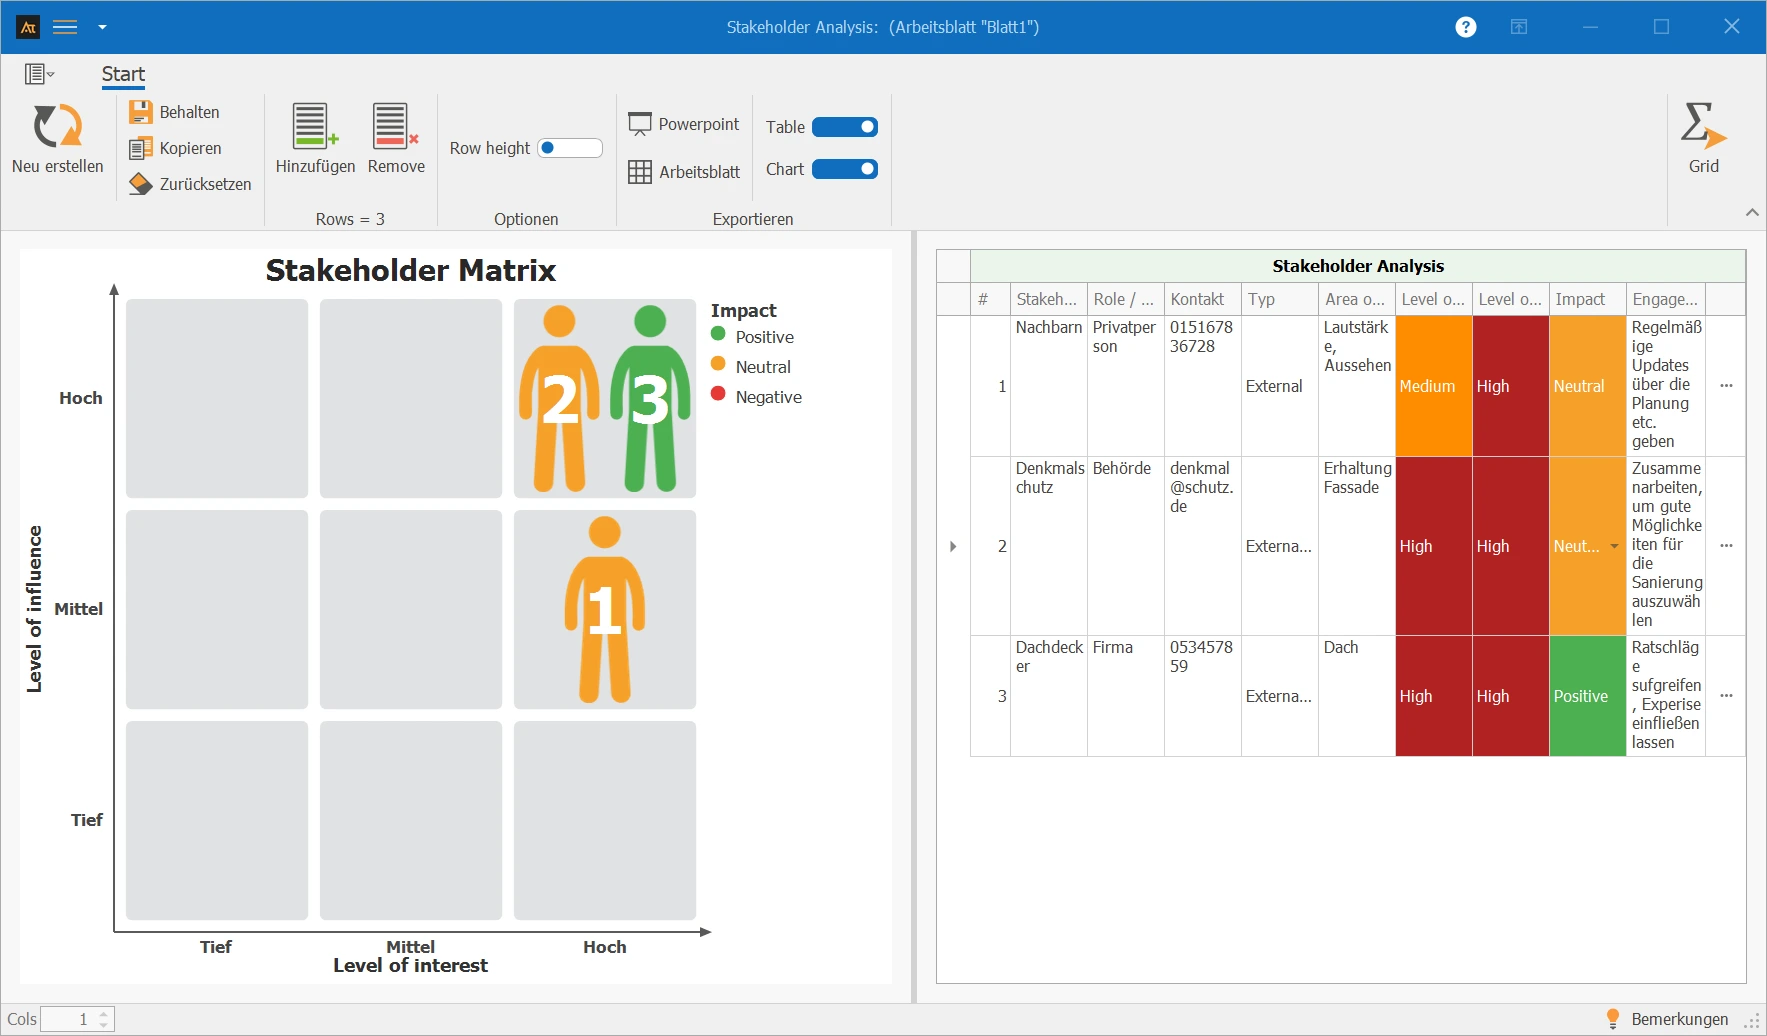
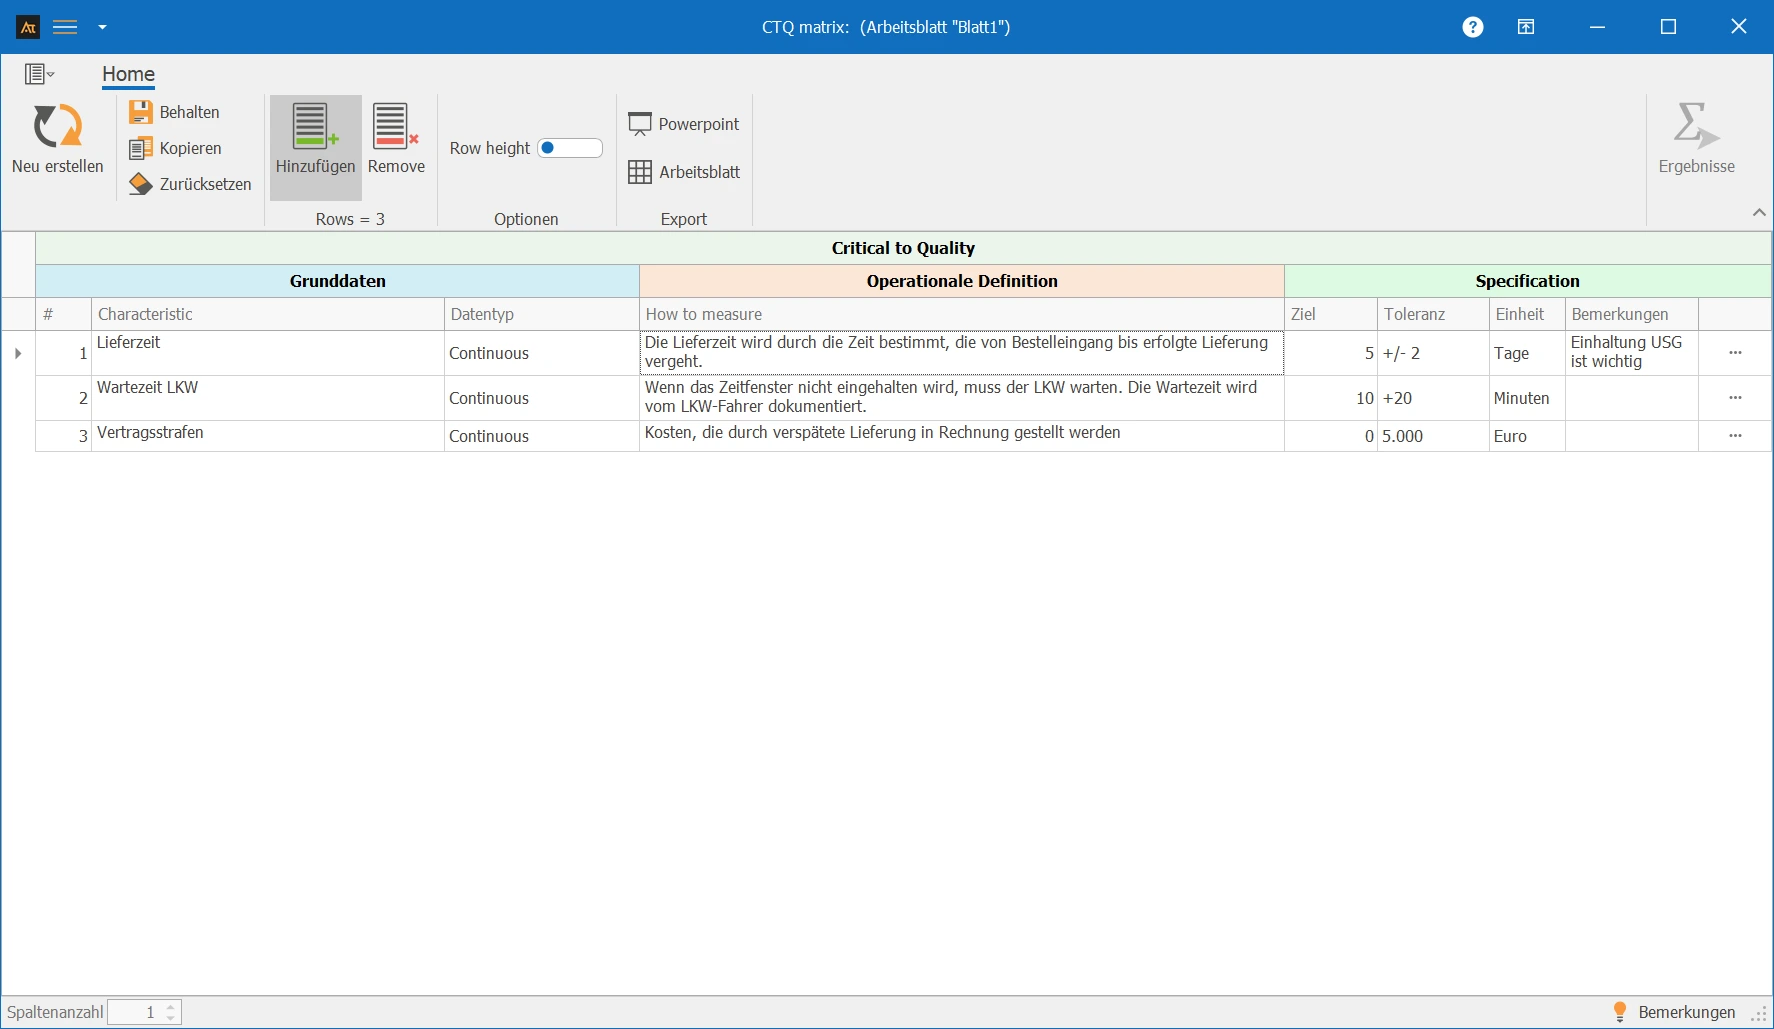
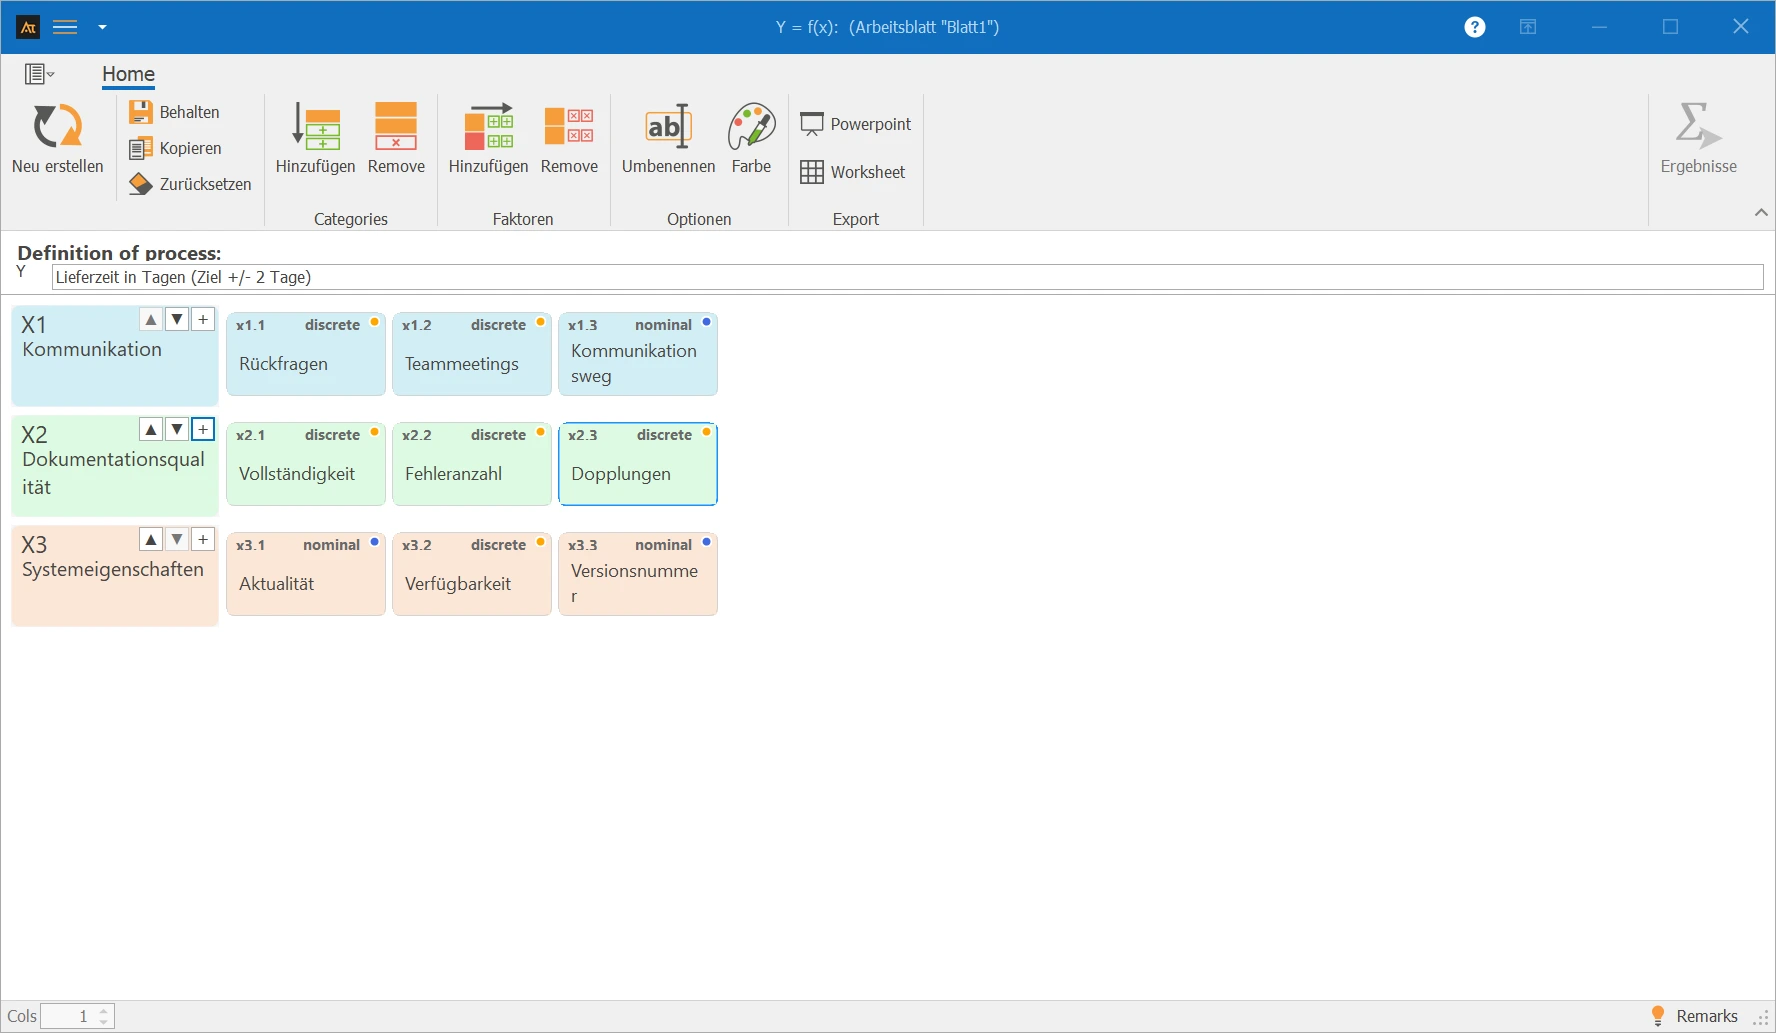
The Define phase is the starting point of a Lean Six Sigma project. It officially begins with the project team's kick-off meeting. The goal of this phase is to clearly define the project – that is, to determine exactly what should be improved and why the topic matters. The project lead works together with the team across several meetings on the required tools and documents to fully accomplish the purpose of the phase. Project boundaries, customer requirements and influencing factors are captured in a structured way.
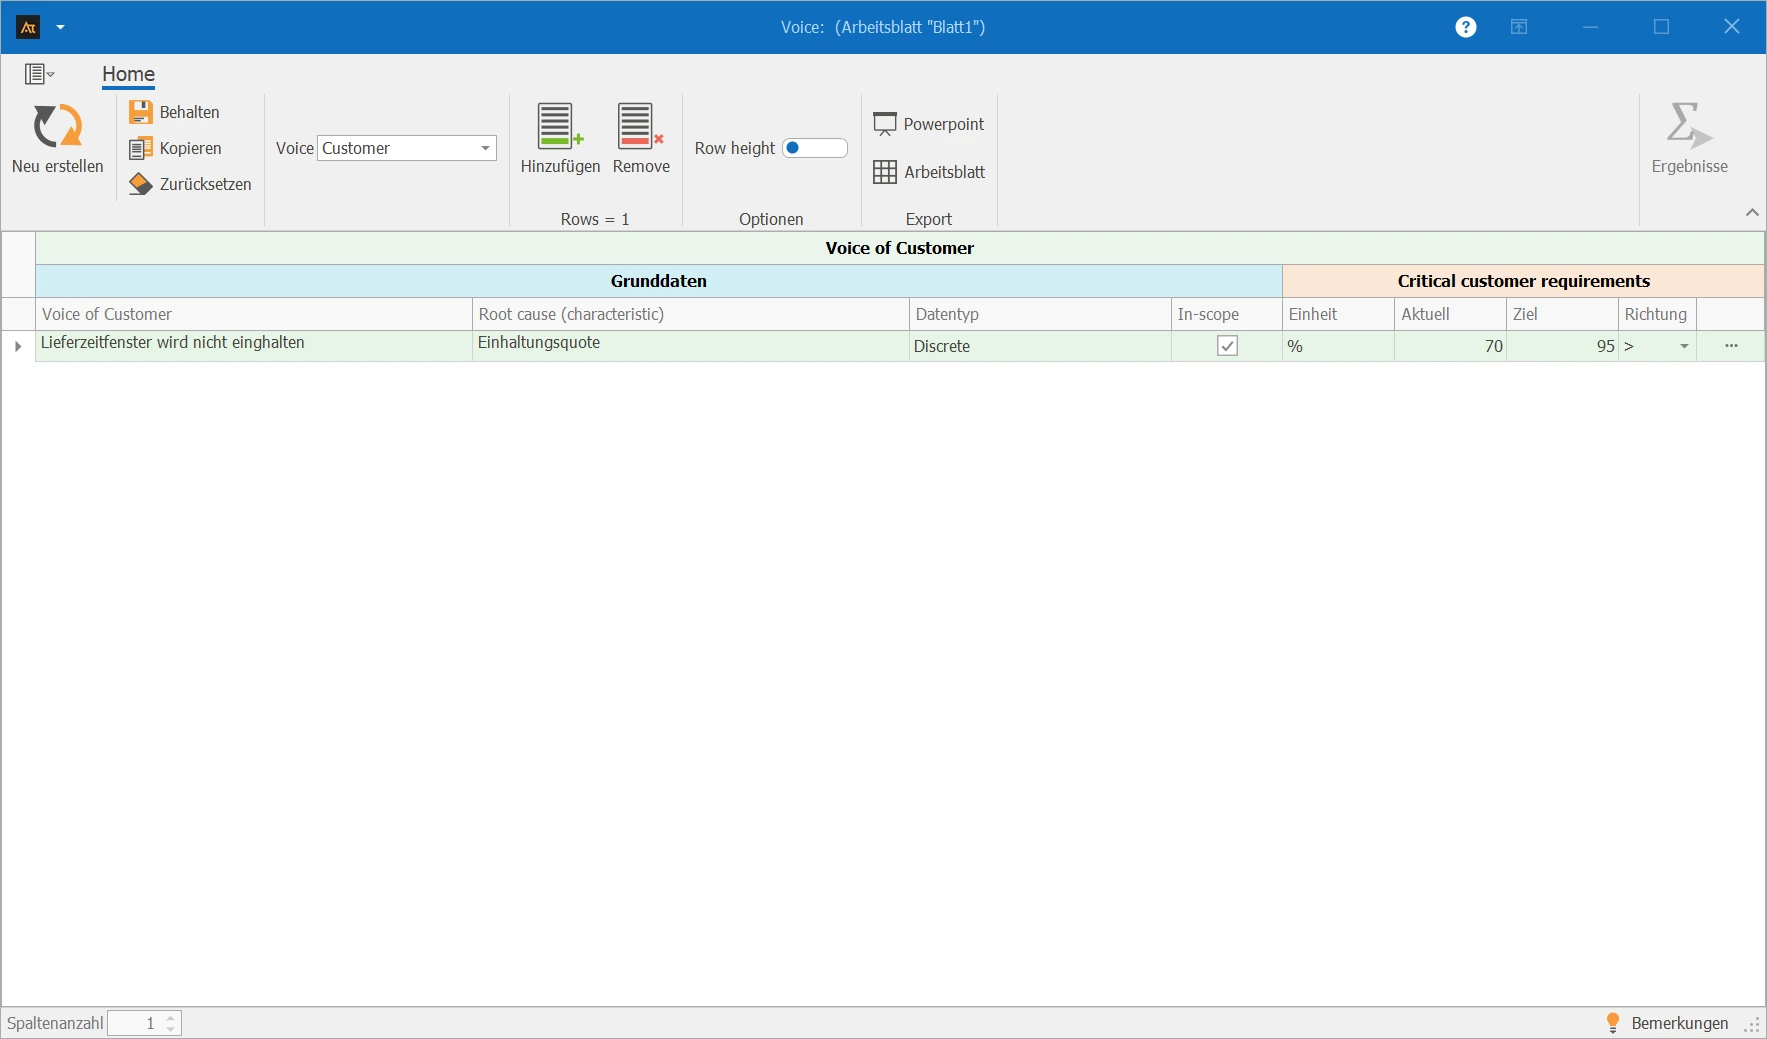
 VOC
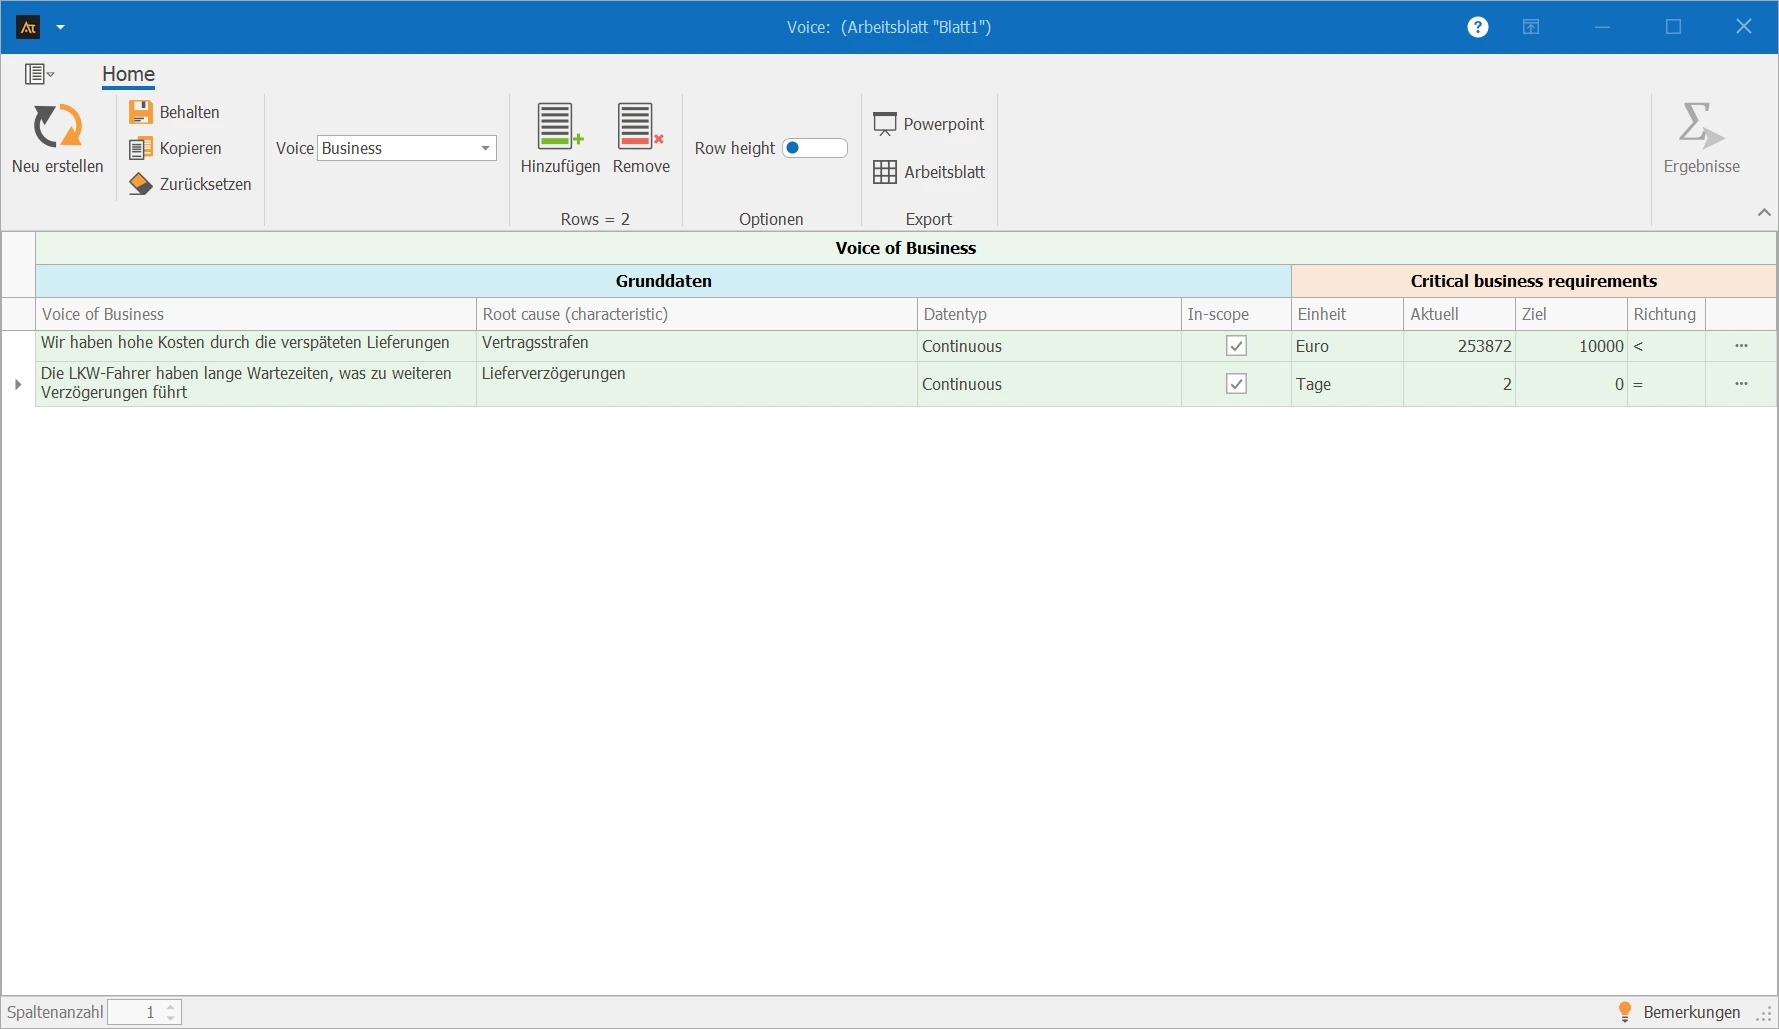
VOC VOB
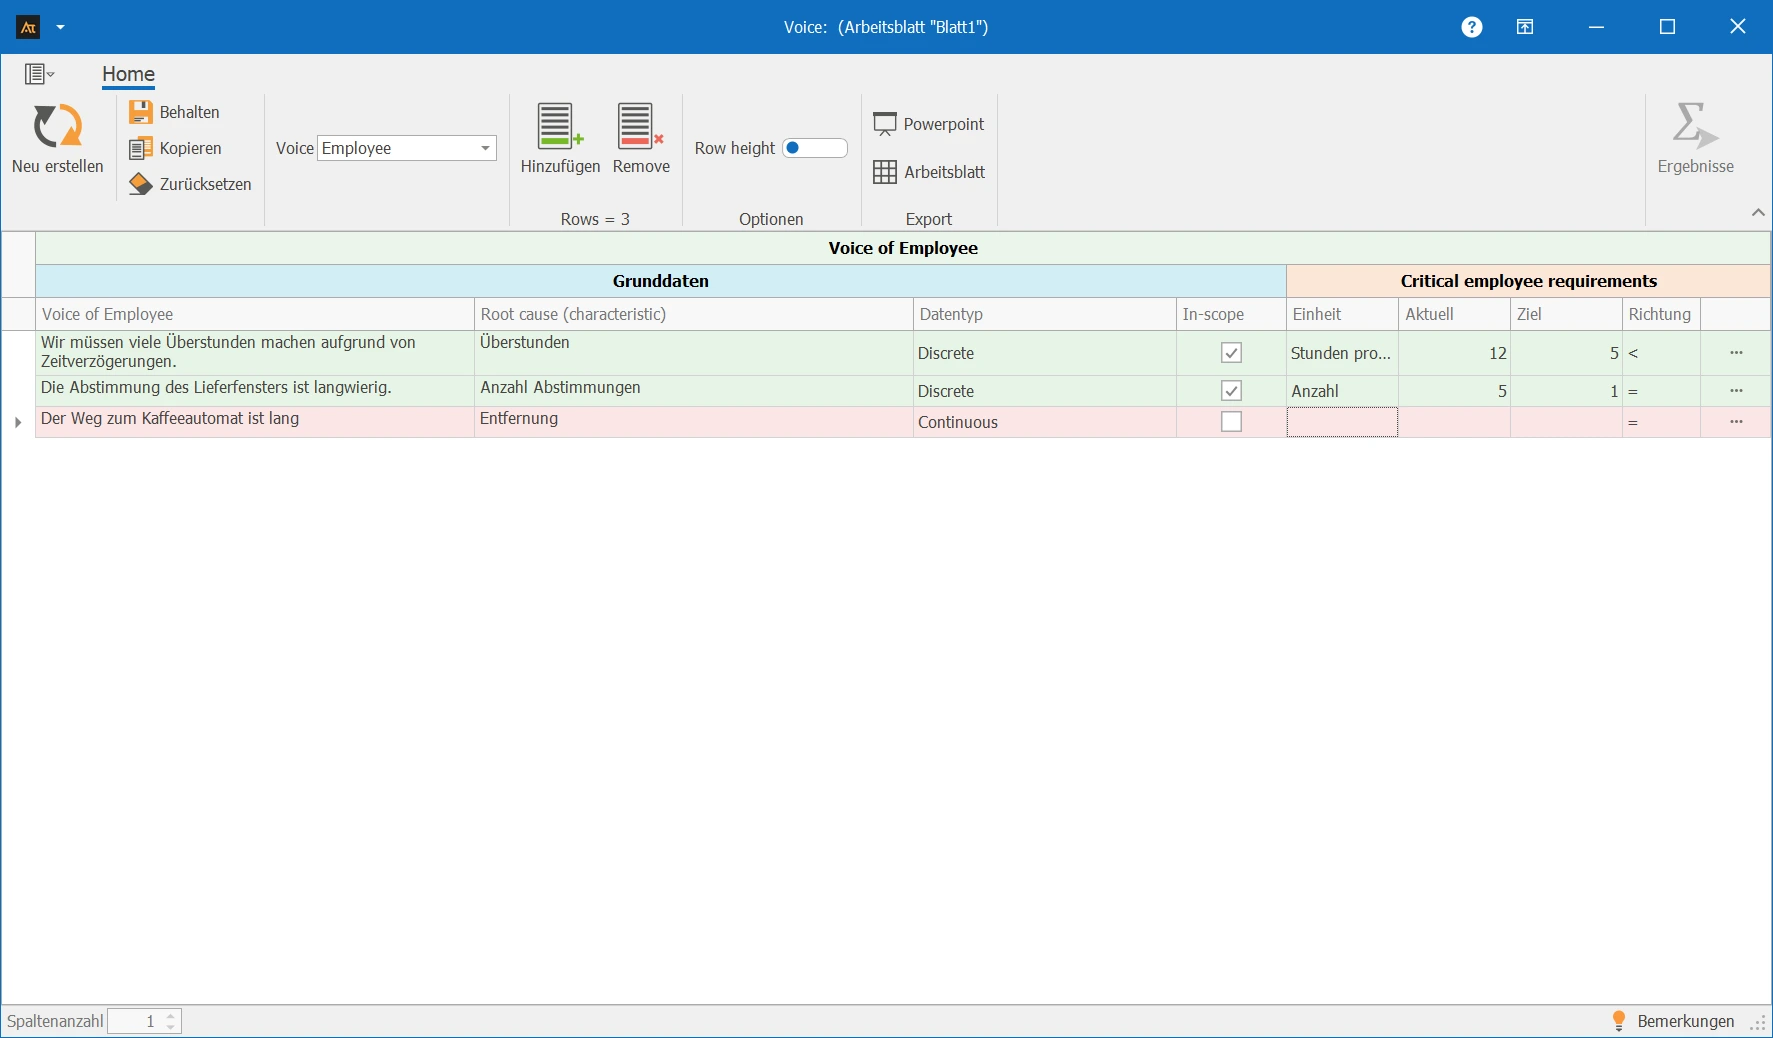
VOB VOP
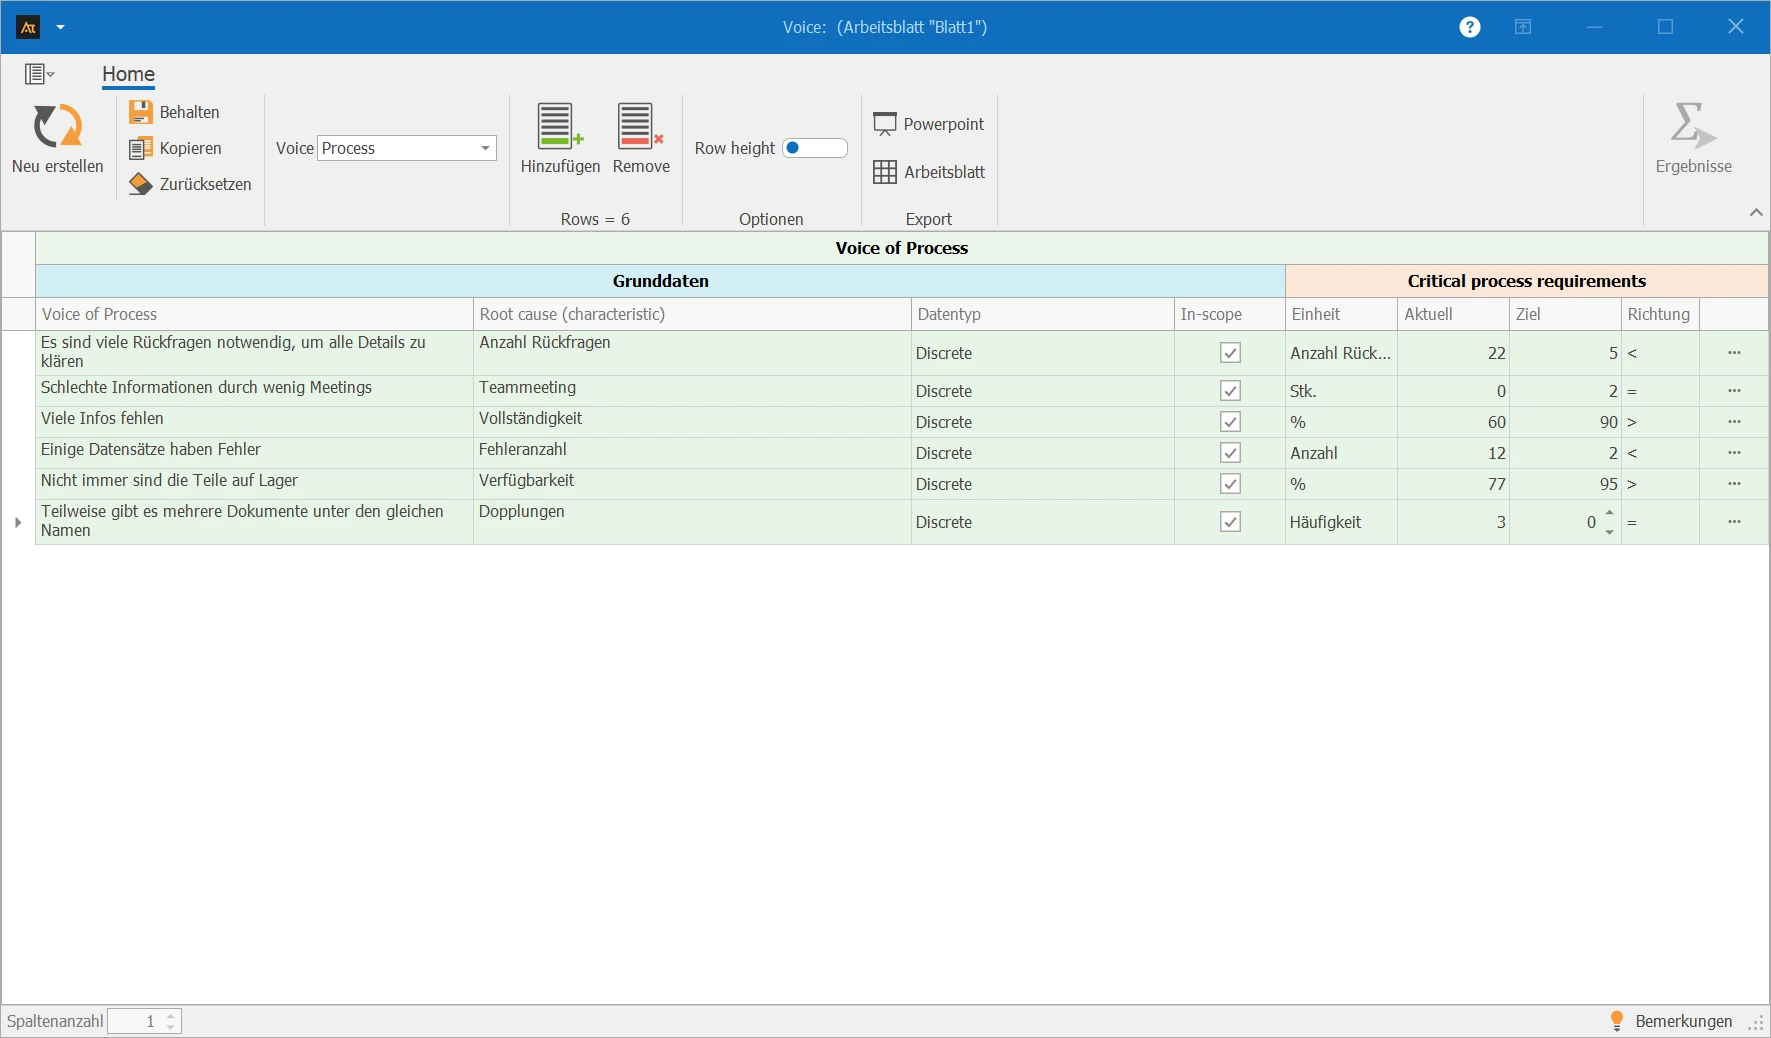
VOP VOE
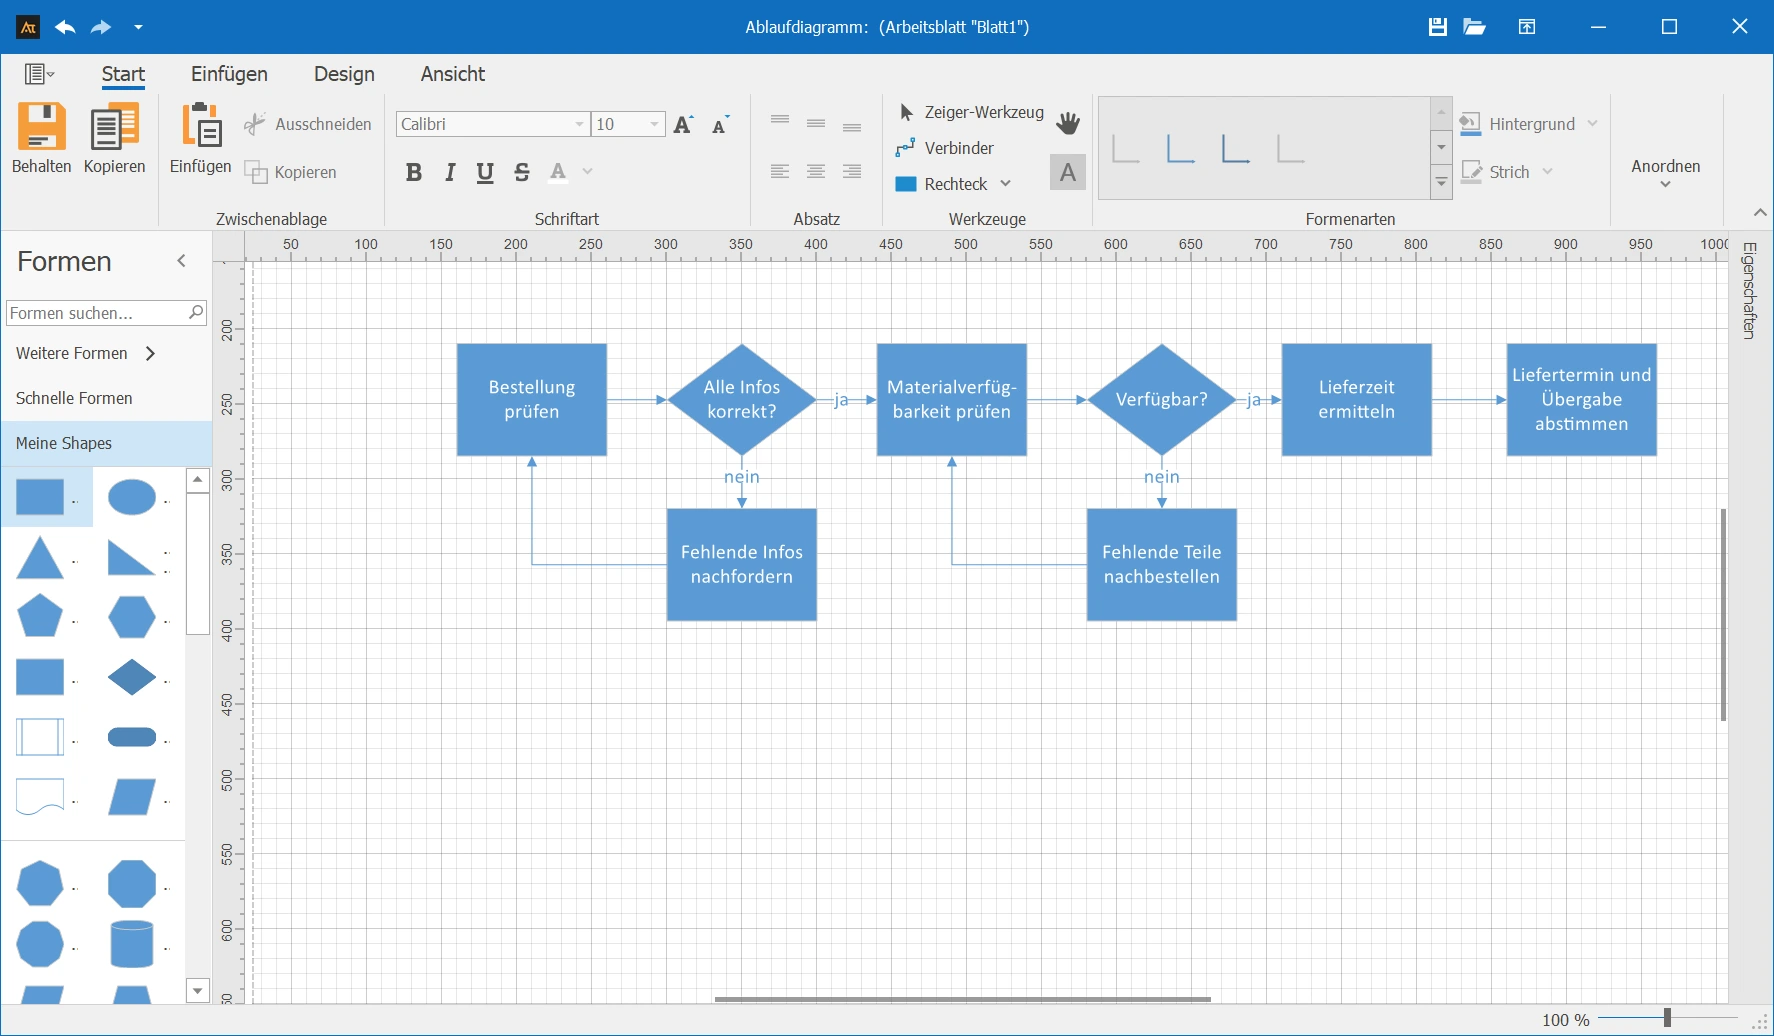
VOE Process Flow Chart
 CTQ Matrix
In the Measure phase, process performance is assessed and the relationships between the influencing factors identified in the Define phase and the pain point (problem) are examined using charts. The goal is to identify anomalies from these charts, which are then investigated more closely in the Analyze phase. If the team finds no anomalies, it goes back step by step: Was the measurement device suitable? Am I looking at the right process? If anomalies are found, further information about them is gathered so they can be examined specifically in the Analyze phase.
 Process Capability
 Data Collection Plan
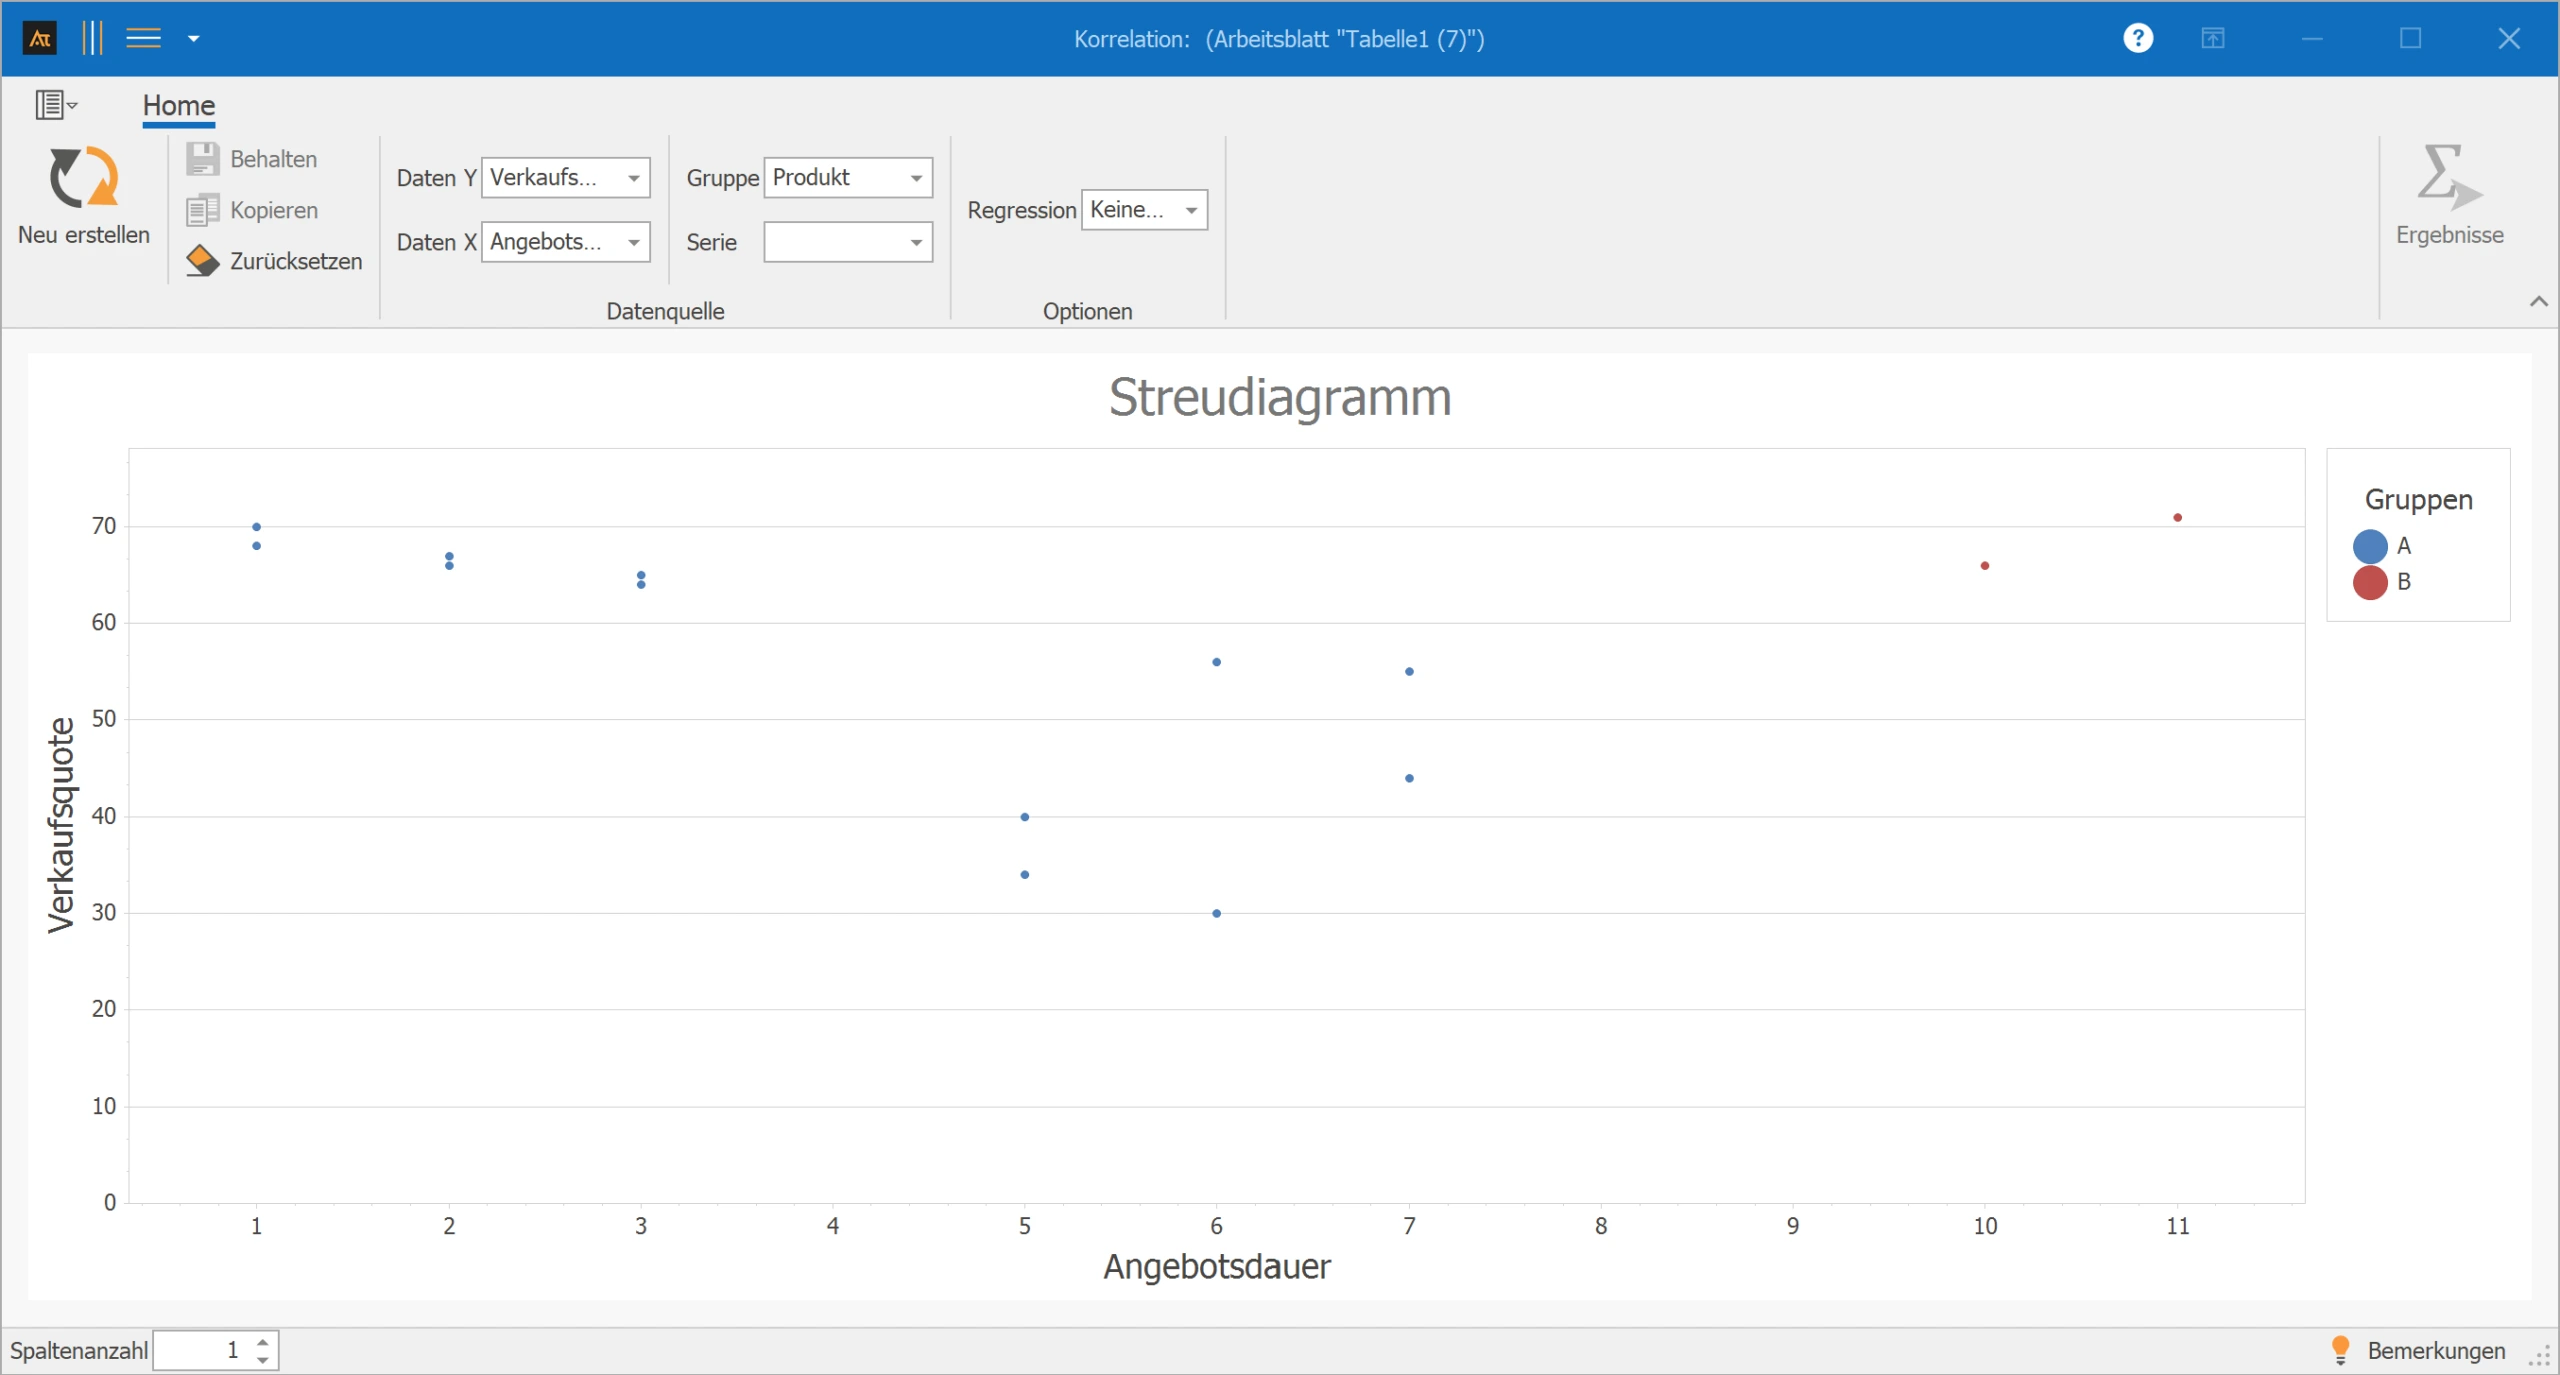
 Scatter Plot
 Boxplot
 Bar Chart
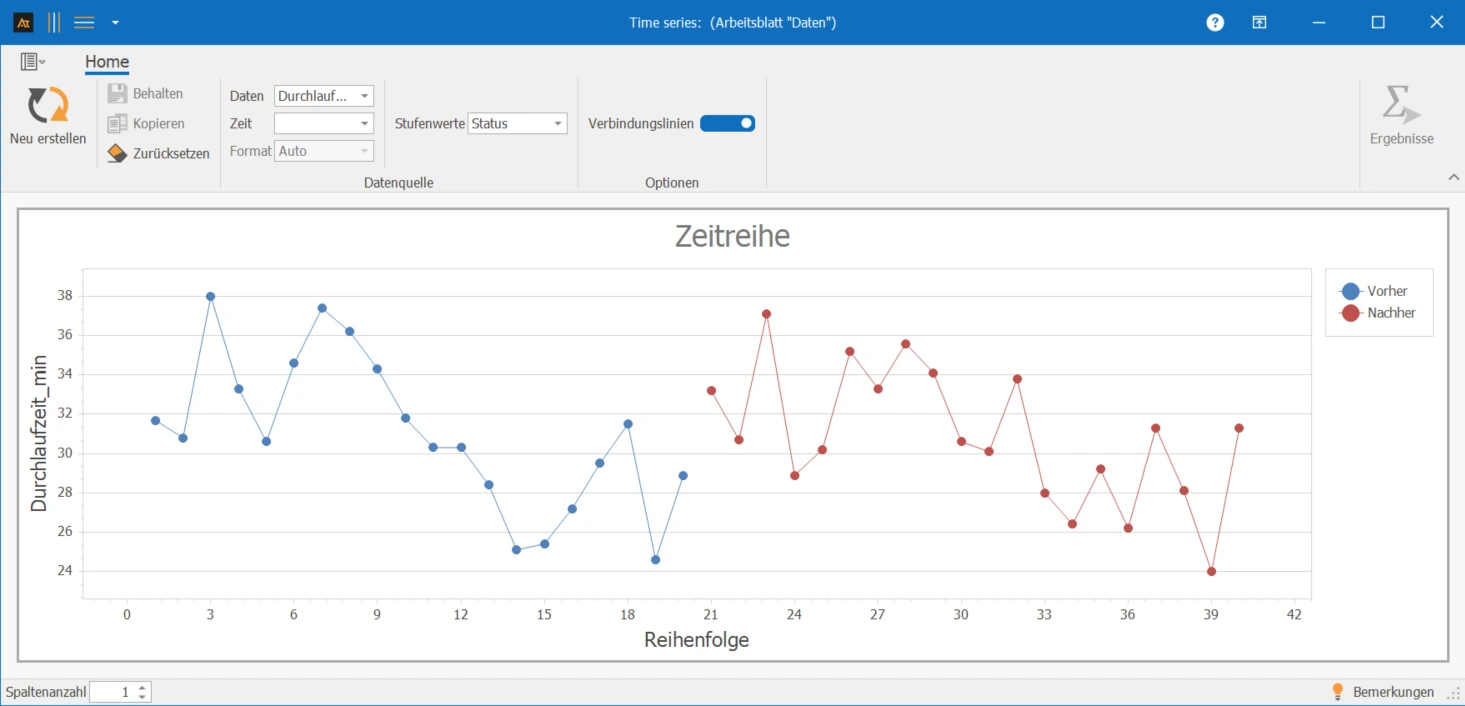
 Time Series
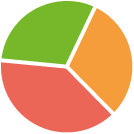 Pie Chart
 Histogram
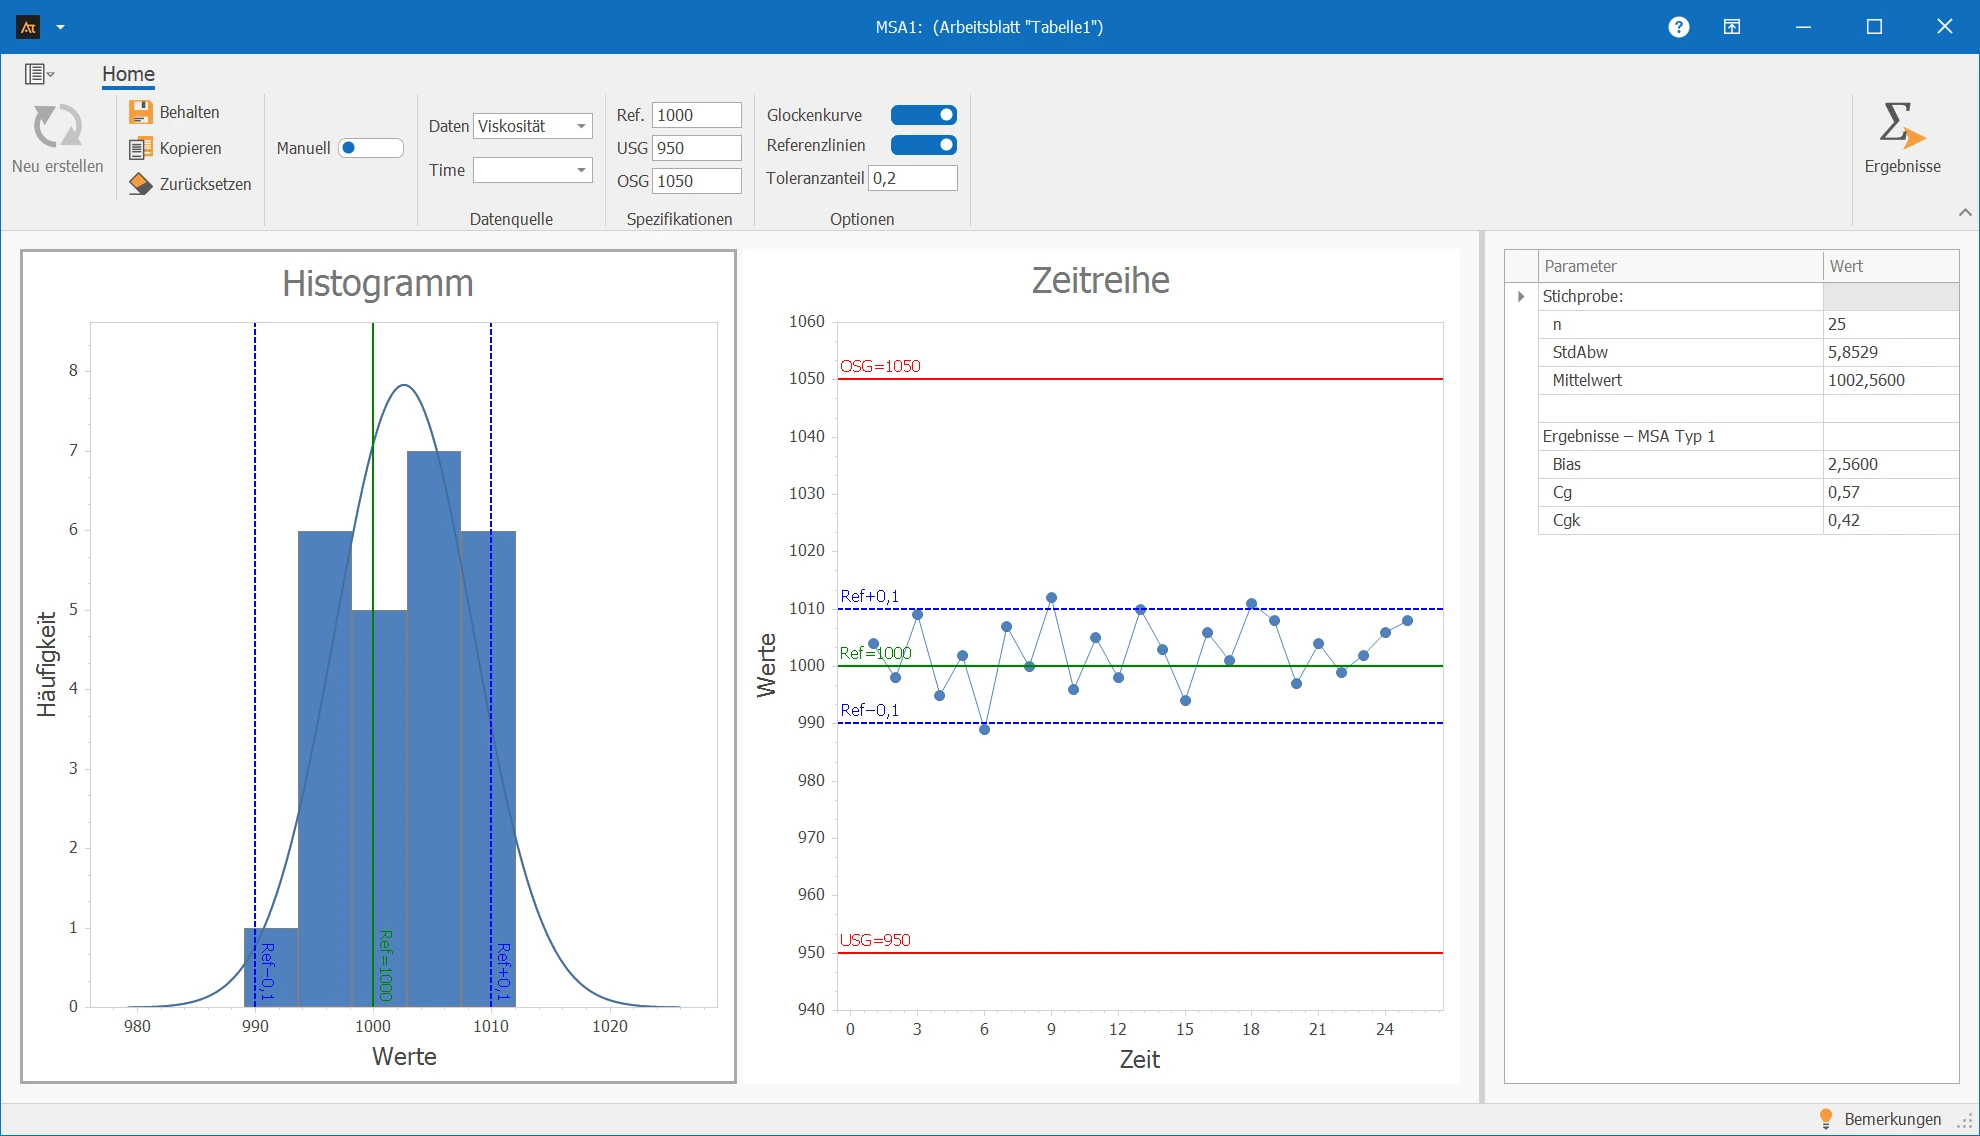
 MSA 1
MSA 1 MSA 2
MSA 2 MSA 2 Attribute
 Normal DistributionDistribution Identification
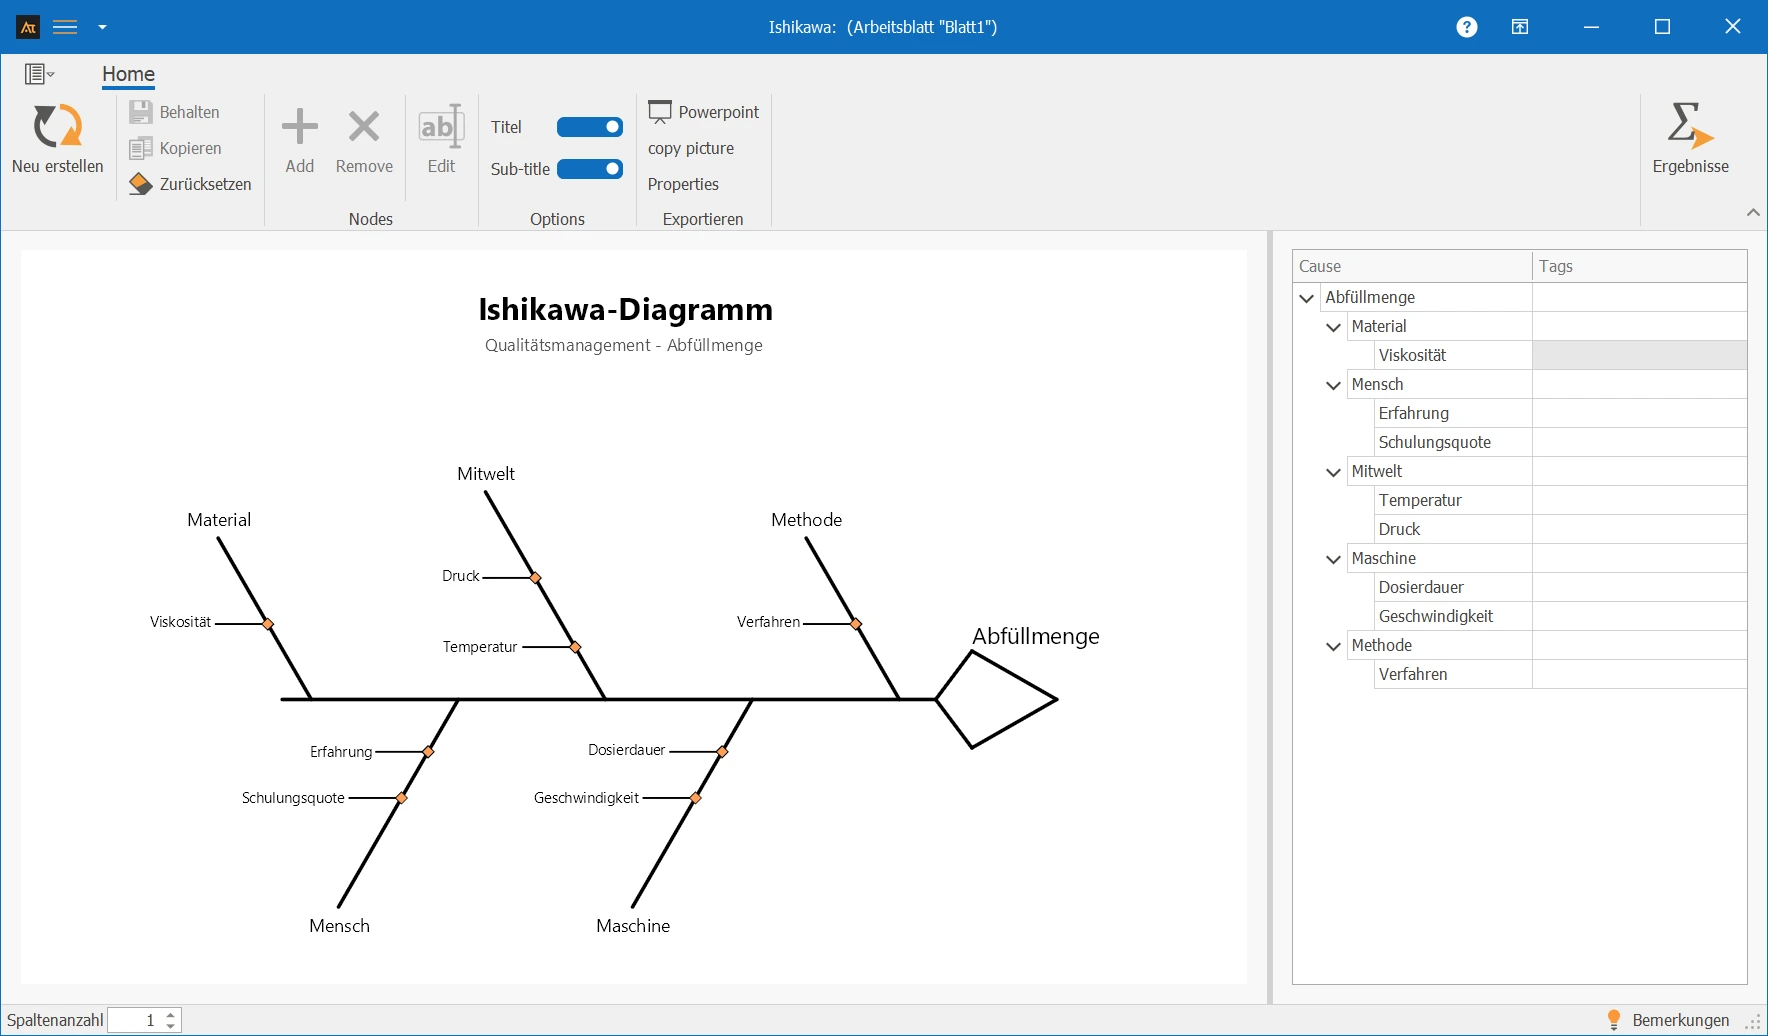
In the Analyze phase, the root causes – that is, the reasons behind the anomalies found in the Measure phase – are identified. This is typically done using tools such as an Ishikawa diagram or the 5-Why method. It's important not to stop until you've found a parameter you can influence, change or adjust. Since there are often several possible root causes, they are weighted and prioritized, for example using the 80/20 rule. The goal is to identify the few but critical root causes that are actually responsible for the problem – and to prove this with statistical analysis.
 Ishikawa Diagram
 C&E Matrix
 Pareto Chart
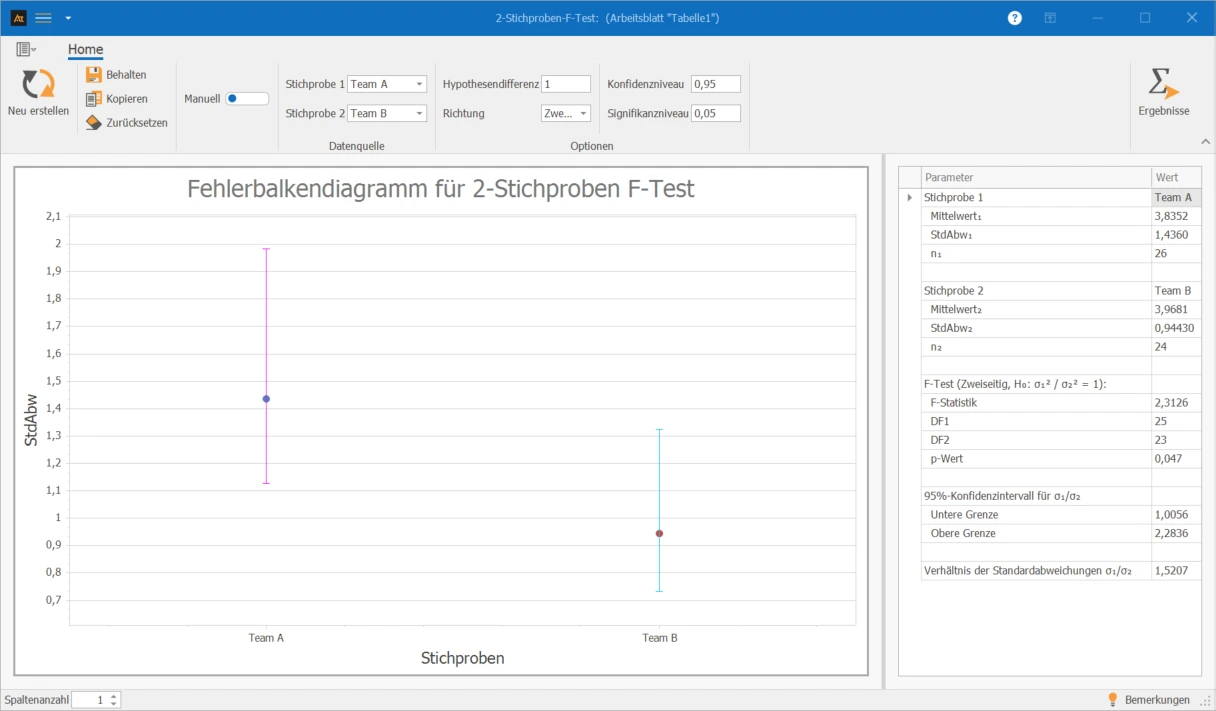
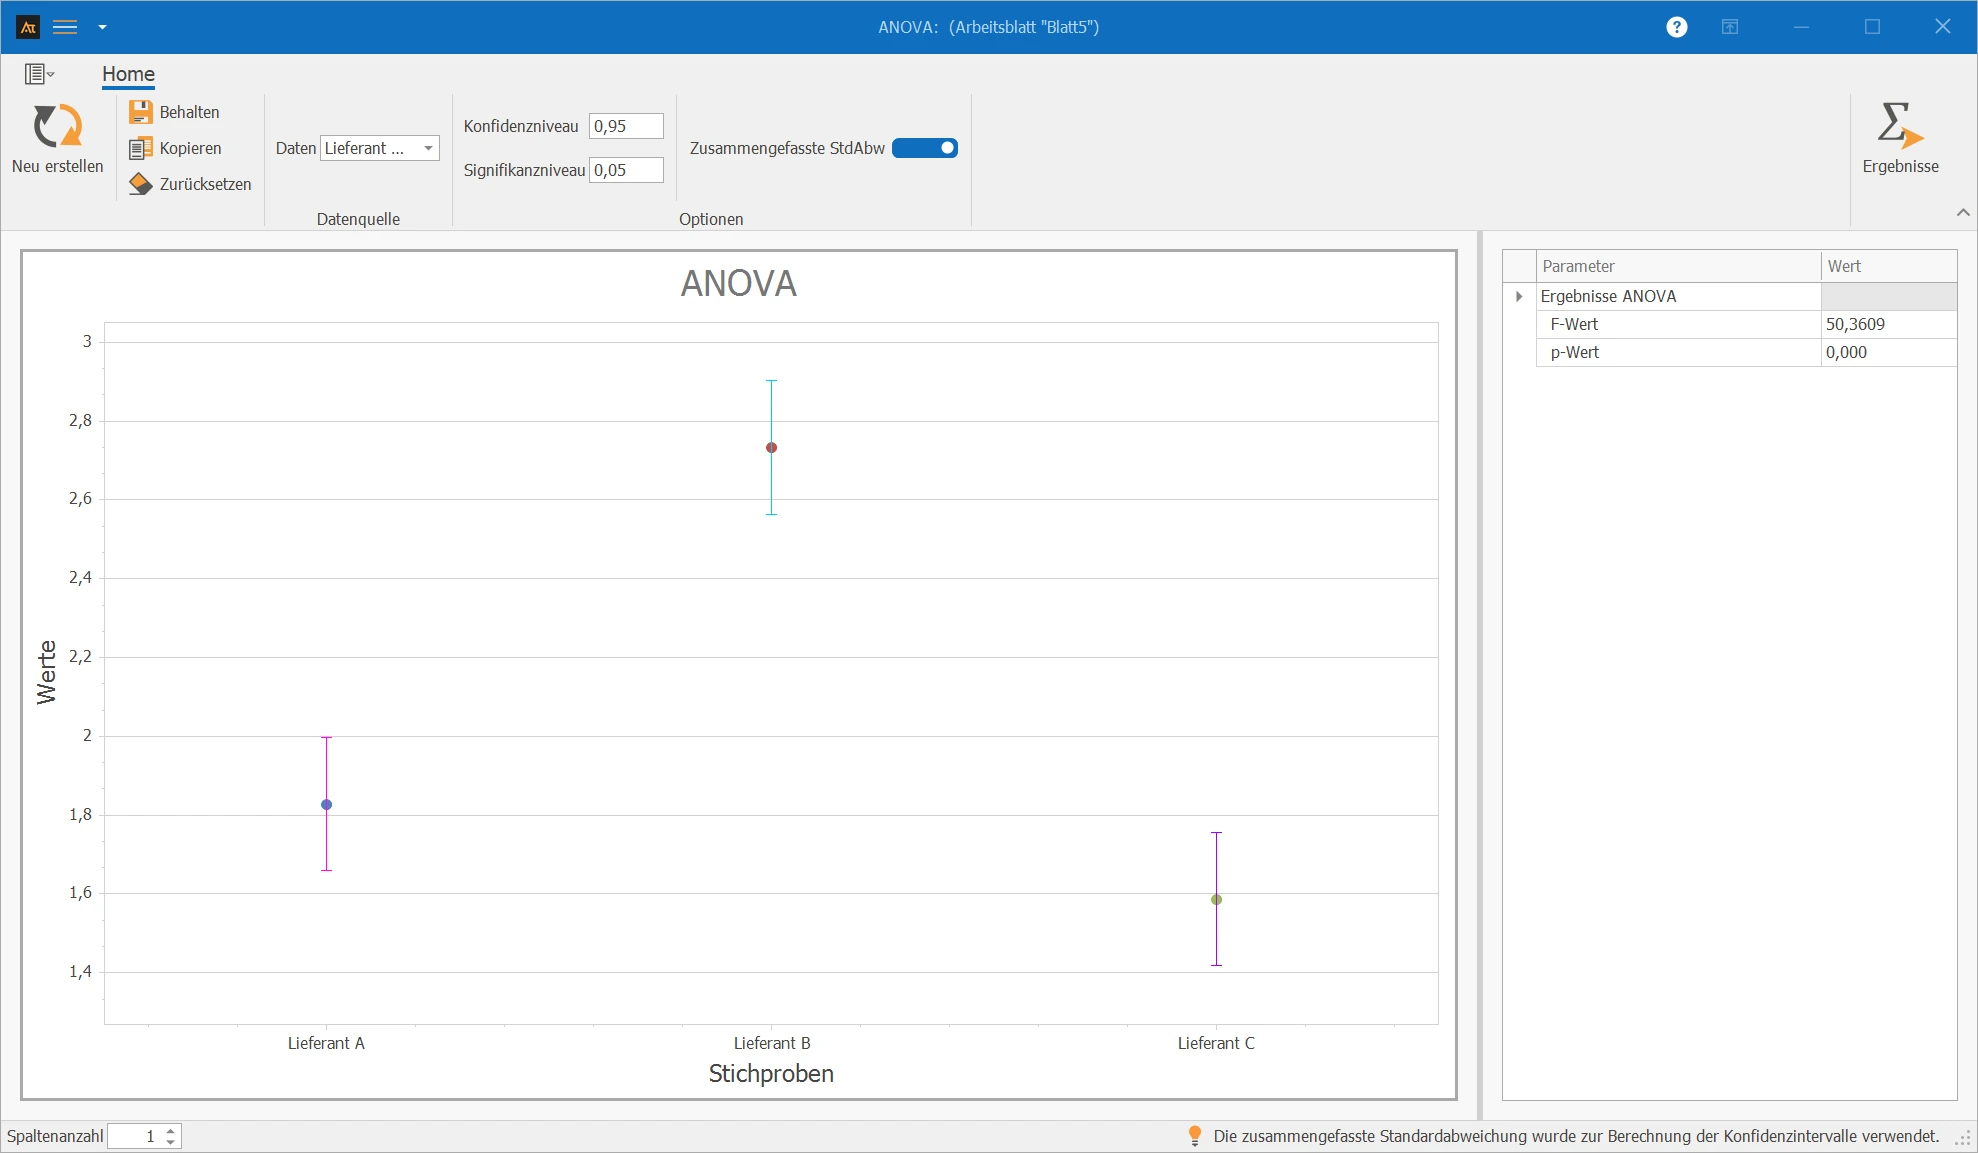
 Hypothesis Tests
 Regression Analysis
In the Improve phase, suitable solutions are developed, tested and implemented for the selected root causes. The team generates creative ideas, evaluates their effectiveness, and runs controlled tests or pilot trials. The goal is to improve the process through appropriate countermeasures. Early improvements – so-called quick wins, i.e. fast, visible successes – often appear already in this phase. It's also important to identify new risks so that the changes don't introduce new sources of error.
 DOE
DOE B&E Matrix
 Process FMEA
 Product FMEA
 Action Plan
In the Control phase, the improvement achieved is stabilized and secured for the long term. The team ensures that the new process continues to function reliably and that deviations are detected early. The goal of this phase is to ensure the project's sustainability. Control mechanisms are introduced, responsibilities are assigned, and the project is officially closed. If the project was successful, that success should also be celebrated together – as recognition of the team's achievement.
 I-Chart
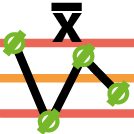 X-Chart
 p-Chart
 np-Chart
 u-Chart
 c-Chart
 Control Plan
A transparent license model with no add-on packages or hidden fees.
AlphadiTab is a software for data-based analysis, problem solving and process improvement.
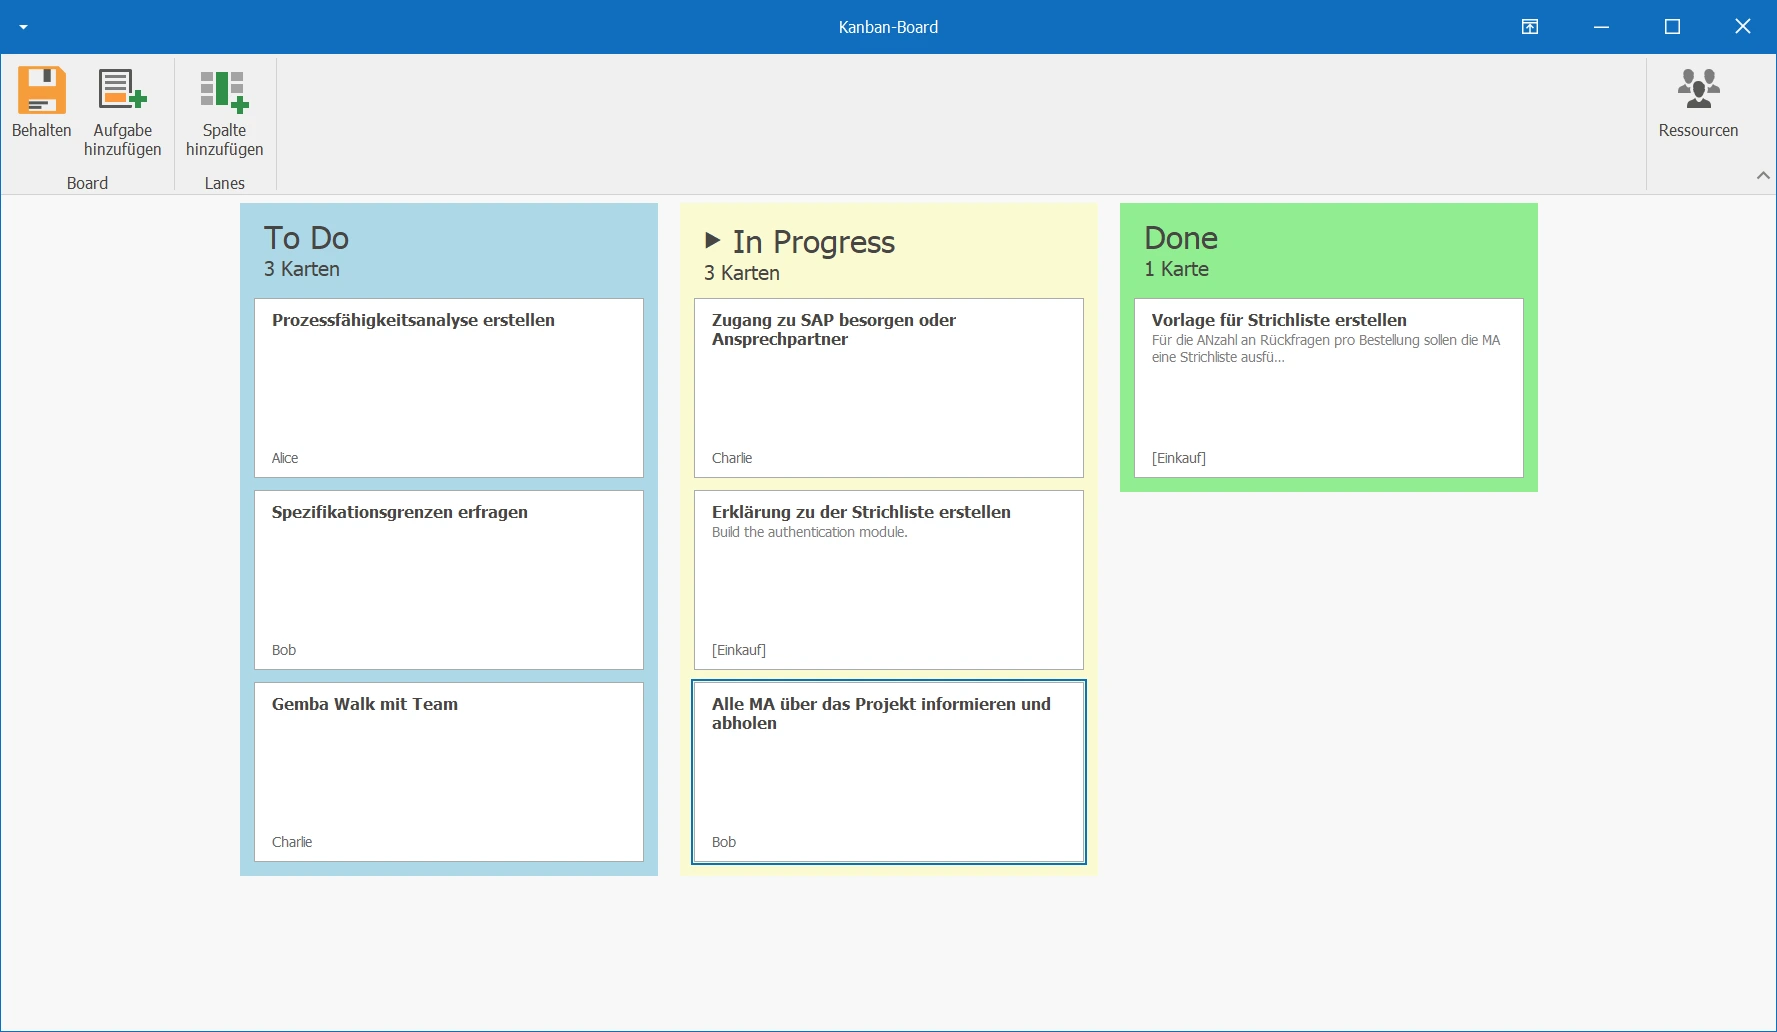
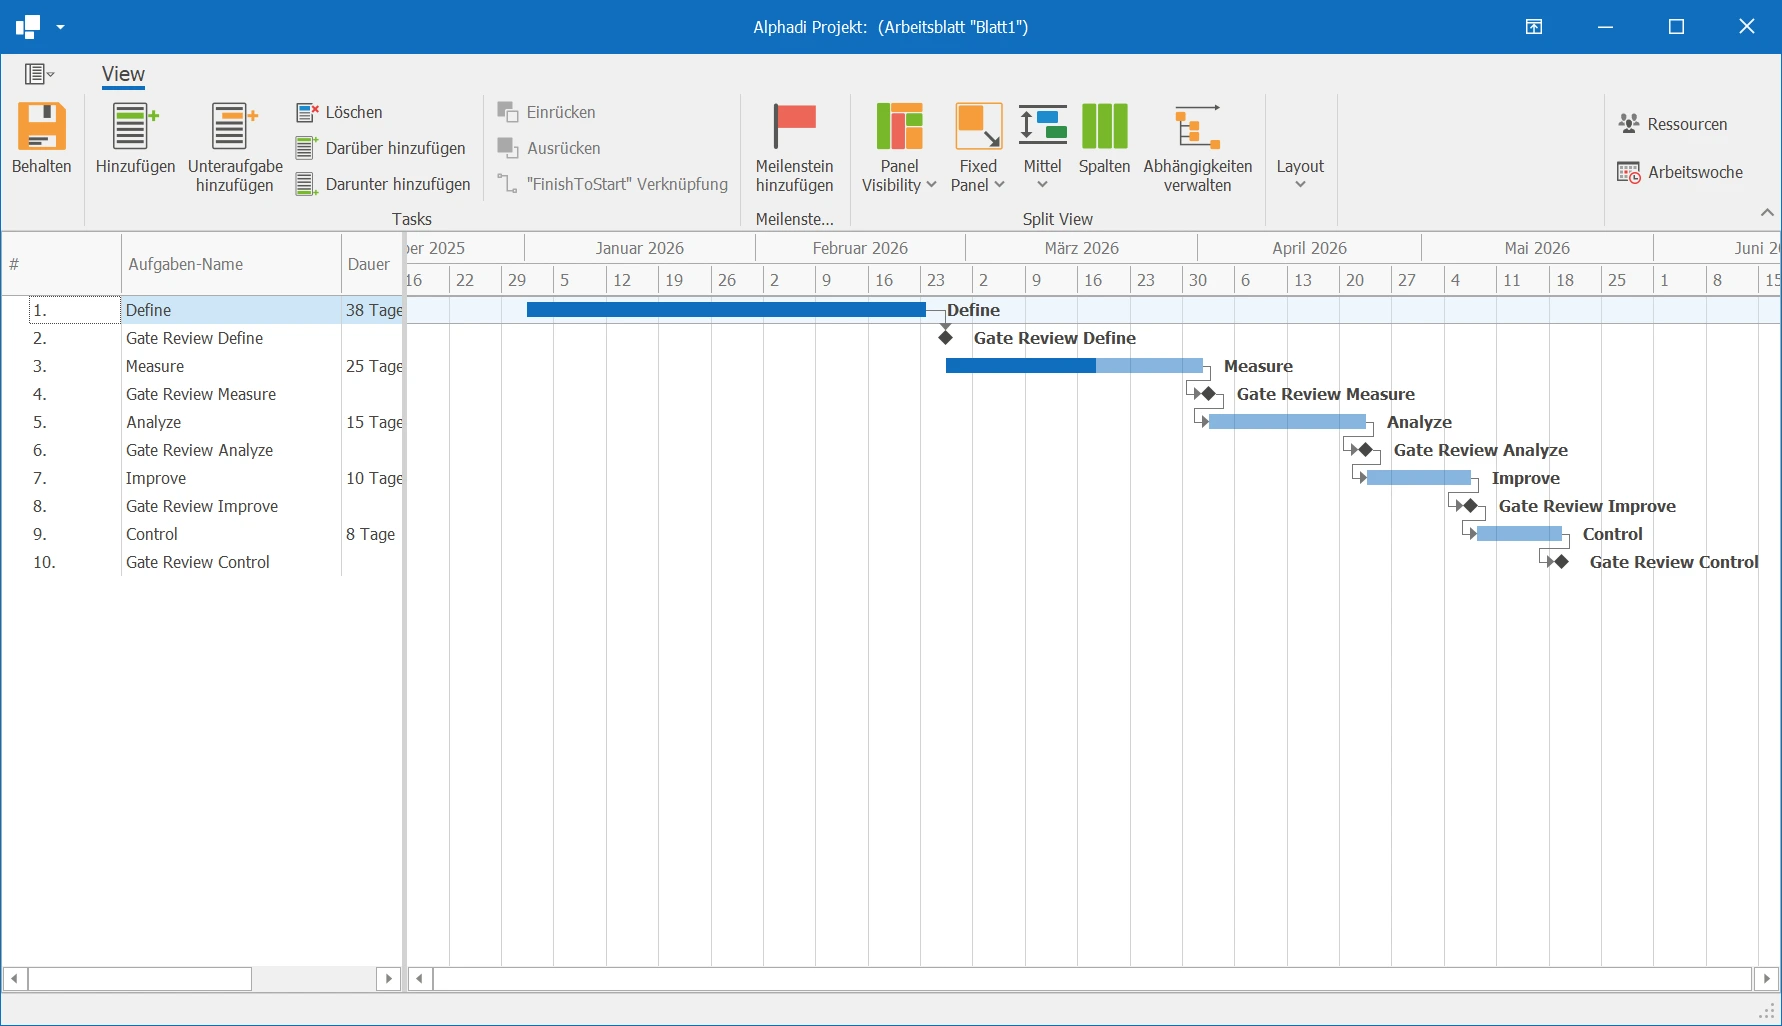
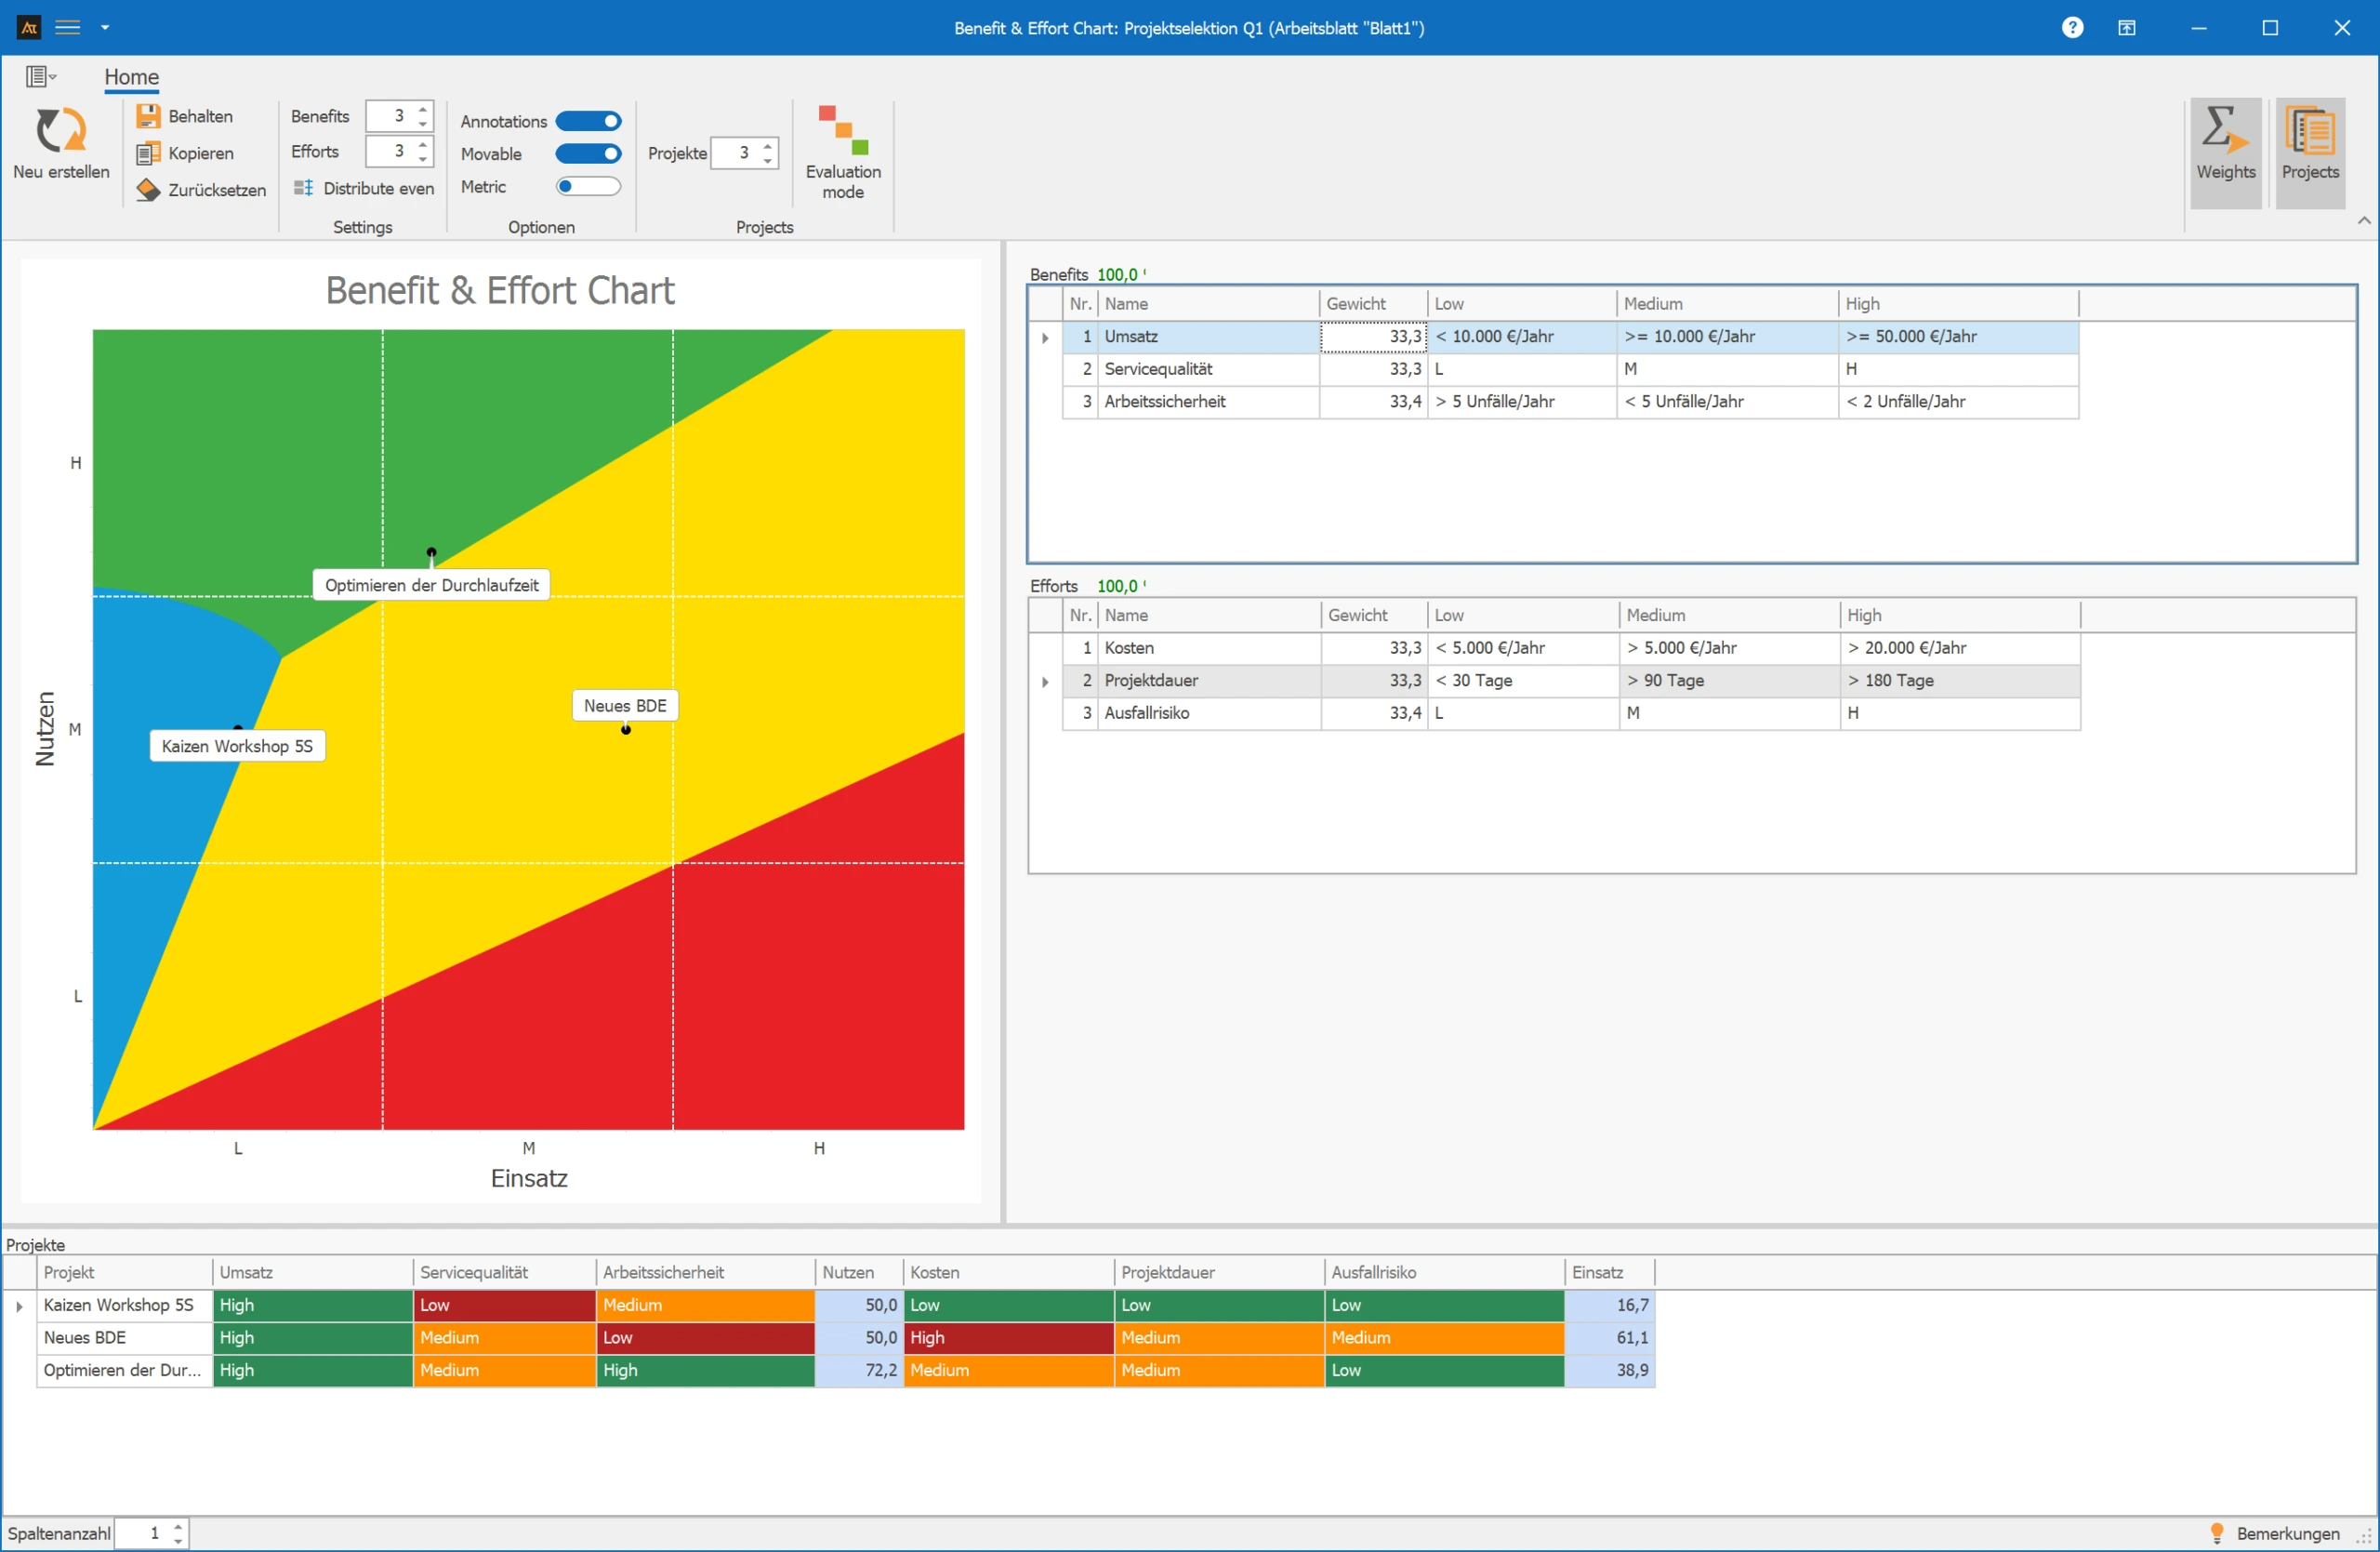
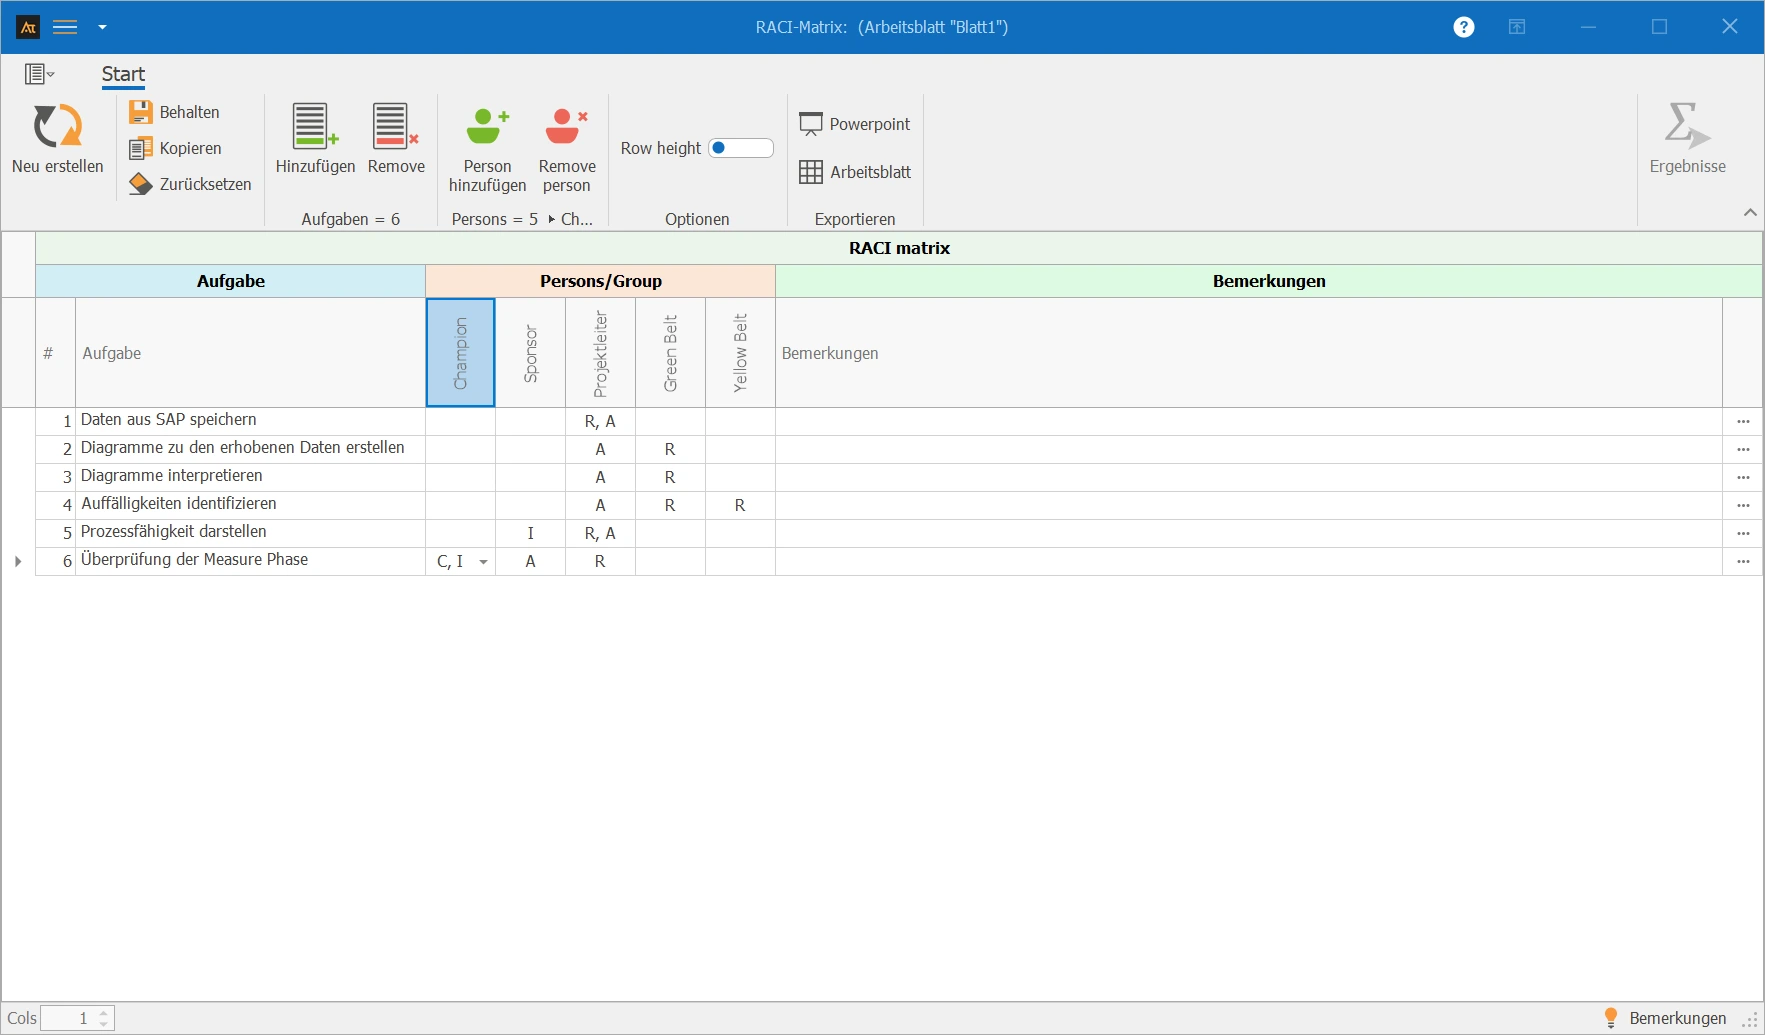
It combines statistical tools with practical management tools — from process capability, SPC, hypothesis tests and regression to the Benefit-Effort matrix, Kanban board and Gantt chart.
AlphadiTab takes off teams' hands the work that keeps them from the actual improvement work: calculations, charts, templates and recurring evaluation steps are ready to use directly. This leaves more time for root cause analysis, decisions and effective improvements.
AlphadiTab is suitable for departments and teams that want to analyze processes, structure problems, or prepare data-based decisions.
This includes, for example, quality assurance, production, logistics, sales, purchasing, service, engineering, project management and controlling.
AlphadiTab is especially helpful when the goal isn't just for individual specialists to work with methods, but to build a shared standard across the team and organization.
AlphadiTab is very well suited for DMAIC projects, but not limited to them.
The tools can also be used in PDCA, continuous improvement, A3 problem solving, or your own improvement processes. What matters is not the name of the method but the task: evaluating data, understanding causes, prioritizing countermeasures, assessing results and implementing improvements.
Even then, AlphadiTab can be worthwhile.
You don't need to know DMAIC perfectly to evaluate data, create charts, or use management tools like Kanban, Gantt, Ishikawa, or the Benefit-Effort matrix.
A basic methodical understanding certainly helps — but AlphadiTab isn't intended only for Six Sigma experts. The software also supports individual analysis, planning and improvement tasks in day-to-day work.
Minitab is a very comprehensive statistics program with many specialized analysis functions. AlphadiTab deliberately takes a different approach: not everything that's technically possible is automatically built in — instead, the focus is on what's actually useful in improvement projects and gets used by the team.
The focus is on practical statistics and management tools that get teams from data to decisions faster. So the priority isn't maximum feature breadth, but actual everyday use: more people can work with the same methods, understand results, and drive improvements together.
Basic knowledge is helpful but not strictly required to get started with many features.
AlphadiTab handles the calculations, creates charts, and presents results in a structured way. What matters, though: the software does not replace subject-matter thinking.
Especially for statistical tests, process capability, or experiment design, the team should be able to interpret the results methodically. AlphadiTab supports the execution — evaluation and decision-making remain with the user.
Yes. AlphadiTab supports importing Excel files, so existing data can be reused directly.
This makes getting started easier, since existing measurement data, error lists, process data or evaluations don't need to be rebuilt from scratch.
Projects are saved in the native .atb format.
AlphadiTab is installed locally.
This means your data stays in your own environment and doesn't need to be uploaded to a cloud. This is especially relevant for organizations with strict requirements around data protection, IT security or internal data policies.
Once the trial period ends, you can decide whether you want to keep using AlphadiTab.
The demo is meant to let you test the software with your own data, tasks and use cases. If you'd like to continue, you can purchase a license and use AlphadiTab permanently.
Yes. AlphadiTab is deliberately designed to be team-friendly.
The advantage: with a manageable budget, multiple users can be equipped, so methodology knowledge doesn't stay with individual specialists but grows across the team and organization.
For multiple users, we're happy to put together an individual quote. Contact us at info@alphadi.org or via the contact form.
If you need support, you can reach out to the Alphadi team.
We help with questions about usage, features, or the right application for your project. You can also report problems, bugs or improvement suggestions directly — for example via the contact form or by email.
It helps if you briefly describe what happened, which feature was affected, and what steps led to the problem. This lets us understand the case faster and address it more precisely.
AlphadiTab is developed further using the same principle behind good improvement work: listen, verify, prioritize and improve in a targeted way.
Not every technically possible feature is automatically built in. What matters is whether a feature is genuinely useful in practice, understood, and helps teams in their work.
Feedback from users, improvement suggestions and concrete requirements from projects therefore flow directly into ongoing development. This way, AlphadiTab grows not through feature overload, but through functionality that is actually used day to day.