


The Measurement System Analysis Type 2 (continuous) is used to assess the suitability of a measurement system considering multiple operators. The focus is on whether different inspectors achieve comparable results when measuring the same characteristic. The MSA Type 2 thus evaluates not only the repeatability but also the reproducibility of the measurement system.

For the measurement system analysis Type 2, the viscosity of the tomato sauce is examined, as this measurement is carried out by several employees in everyday production.
First, 10 filled tomato jars are selected from the ongoing production.
The jars cover the relevant viscosity range of the production and are within the specification limits of 950 to 1050.
The rotational viscometer used in everyday life is used as the measuring instrument.
The measurement conditions (measuring device, measurement method, temperature, and sample preparation) are determined in advance and kept constant throughout the entire measurement.
For the analysis, three inspectors are selected who also carry out the viscosity measurement in normal shift operation.
Each inspector measures all 10 tomato jars once, with the order of the jars being chosen randomly.
After all three inspectors have completed the first run, a second run takes place at a later time.
Each inspector measures all 10 jars again, again in random order. The two measurements of an inspector do not take place directly one after the other.
All measurement results are documented and assigned to the respective inspector and part.
The recorded measurement values are then evaluated in AlphadiTab for the measurement system analysis Type 2 (continuous).
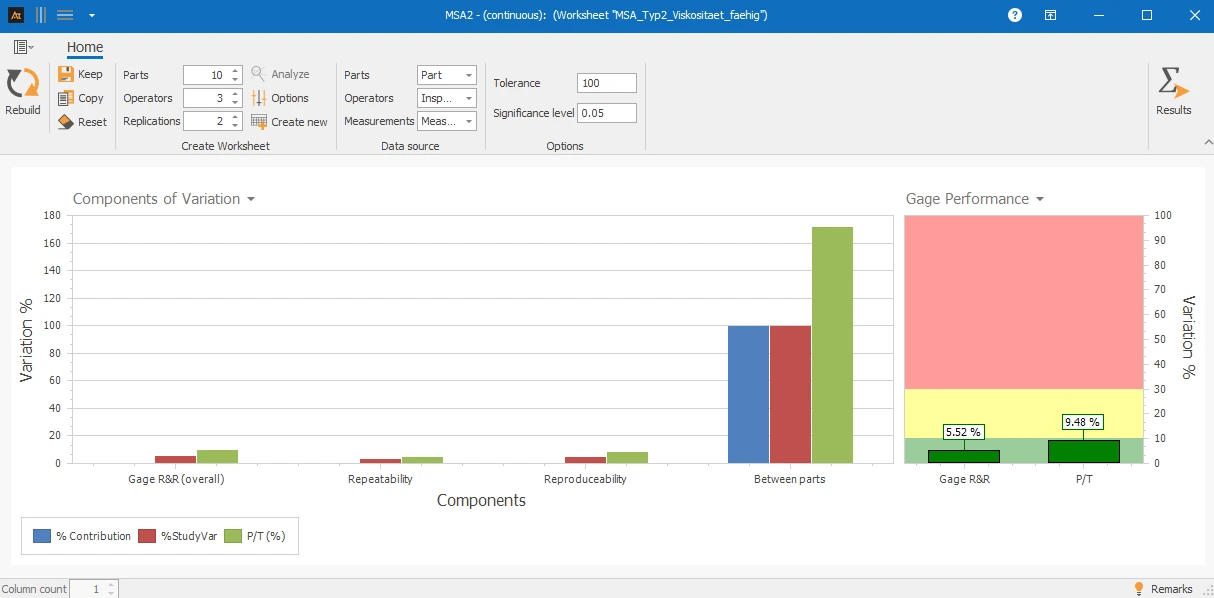
Explanations of the results:
The measurement system analysis Type 2 shows that the measurement system is suitable.
The proportion of measurement system variation (Gage R&R total) is 5.52 % and is therefore below the guideline value of 10 %.
Both repeatability and reproducibility contribute only slightly to the total variation.
The majority of the variation is caused by differences between the parts.
The P/T value of 9.48 % confirms that the measurement system variation is sufficiently small in relation to the tolerance.
The viscosity measurements can be used for further process and capability analyses.
Explanations of the graphic:
Left image
The left diagram shows different aspects of measurement system variation.
- Blue bar (% contribution):
Shows the percentage contribution of the respective component to the total variation. - Red bar (6 × standard deviation):
Represents the spread of the respective component based on six times the standard deviation. - Green bar (only visible if tolerance is specified):
Shows the proportion of the respective spread in relation to the specified tolerance.
The components shown are:
- %Gage R&R (total measurement system)
- Repeatability
- Reproducibility
- Variation between parts
The first three components (%Gage R&R, repeatability, and reproducibility) describe the measurement system variation.
These shares should ideally be under 10 % as they should have little or no influence on the total variation.
The variation between parts describes the actual differences between the measured parts.
Here it is desirable that the bars are as large as possible. This shows that the majority of the observed variation is caused by real differences between the parts and not by the measurement system.
Right image
The right diagram visualizes the two most important summary metrics of the measurement system analysis:
- %Gage R&R:
Proportion of measurement system variation to total variation. - P/T value (only visible if a tolerance is specified):
Ratio of measurement system variation to tolerance width.
Both metrics should be under 10 % for the measurement system to be considered well-suited.
Higher values indicate that the measurement system has too much influence on the measured results.
Preparation
- Select a continuous measurement variable (e.g., viscosity).
- Determine a suitable measuring instrument.
- Select several different produced parts that cover the relevant feature range.
- Select several inspectors.
- Determine the number of repeat measurements per inspector.
- Define and maintain constant measurement conditions.
- Create a worksheet for MSA Type 2.
- Conduct measurements: The measurements of the individual inspectors must be carried out independently of each other.
 Use in AlphadiTab
- Select the tool MSA Type 2 continuous in the Measure Phase.
- Enter the number of parts, inspectors, and repetitions.
- Enter measurement values.
- Start analysis with “Create New”.
Interpretation
- Gage R&R total < 10%: Measurement system suitable.
- Gage R&R total 10–30%: Measurement system conditionally suitable, decide depending on application.
- Gage R&R total > 30%: Measurement system not suitable.
Filling quantity tomato sauce
In the production of tomato sauce, the filling quantity is regularly monitored. The filling quantity is specified as 500 ml. For MSA Type 2, 10 filled tomato jars are taken. The filling quantity is determined using a calibrated scale.
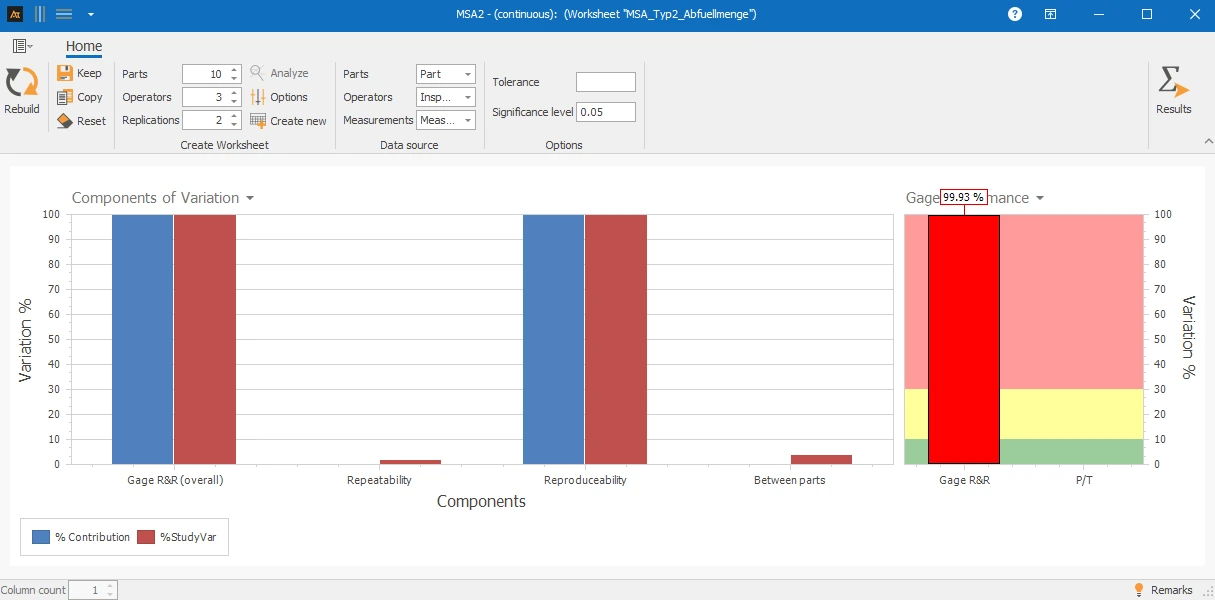
Interpretation:
The evaluation shows that the measurement system is not suitable. The proportion of measurement system variation (Gage R&R total) is 99.93 % and thus almost completely dominates the total variation. The actual differences between the parts cannot be reliably captured with this measurement system. The repeatability is good, as the variation within the inspectors is low. However, the reproducibility is poor: the inspectors come to significantly different results.
Lead Time in Goods Receipt
The lead time in goods receipt is determined from timestamps of the IT system, for example, from the time of physical goods receipt and the completion of booking in the system.
The time values are thus not collected with a traditional measuring instrument, but are generated systemically. For this reason, no formal measurement system analysis (MSA Type 1 or Type 2) in the classical sense is applicable for lead times in goods receipt, as neither a measuring instrument nor inspectors in the sense of the MSA are considered.
Response Time IT Helpdesk
The response time in the IT helpdesk is calculated from the timestamps of the ticket system, such as from the ticket opening and the first documented response.
Here, too, these are automatically recorded time data and not measurements of a physical measuring instrument. Therefore, a classic measurement system analysis is not directly applicable, as neither a measuring instrument nor inspectors are considered in the sense of the MSA.
Continuous data: Data collected with a measuring instrument that can have both units and decimal places.
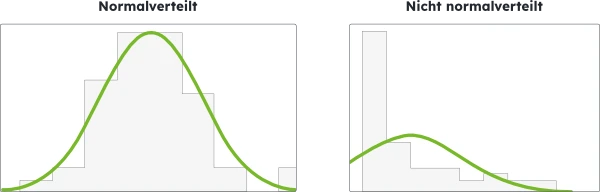
Normally distributed data: Data that can be well described by a normal distribution. This can be checked, for example, with a test for normal distribution.
OSG = OTG = Upper specification or tolerance limit: The maximum permissible value for the target size. If a measurement exceeds this, it is considered not okay.
USG = UTG = Lower specification or tolerance limit: The minimum permissible value for the target size. If a measurement falls below this, it is considered not okay.
Measurement system analysis (MSA): Procedure for assessing the suitability of a measurement system.
MSA Type 2 (continuous): Measurement system analysis for evaluating the repeatability and reproducibility of a measurement system with continuous measurement data.
Part: Individual, real produced product that is measured as part of the measurement system analysis.
Inspector: Person who performs measurements.
Gage R&R: Proportion of measurement system variation in the total variation, consisting of repeatability and reproducibility.
Repeatability: Variation in measurement results when the same inspector measures the same part multiple times with the same measuring instrument.
Reproducibility: Differences in measurement results that occur when different inspectors measure the same part with the same measuring instrument.
% Tolerance = P/T: Proportion of measurement system variation in the specified tolerance range.