


The test for normal distribution is used to check whether the available data can be adequately described by a normal distribution. Many statistical methods, such as process capability analysis with Cp and Cpk, assume normally distributed data. The test provides indications as to whether this requirement is met.

During the production of tomato sauce, viscosity values are regularly recorded. Before further analyses can be conducted, it must be checked whether the measurements are approximately normally distributed. The p-value is 0.111. Since this is greater than 0.05, there is no indication of a deviation from the normal distribution - the data can be treated as approximately normally distributed.
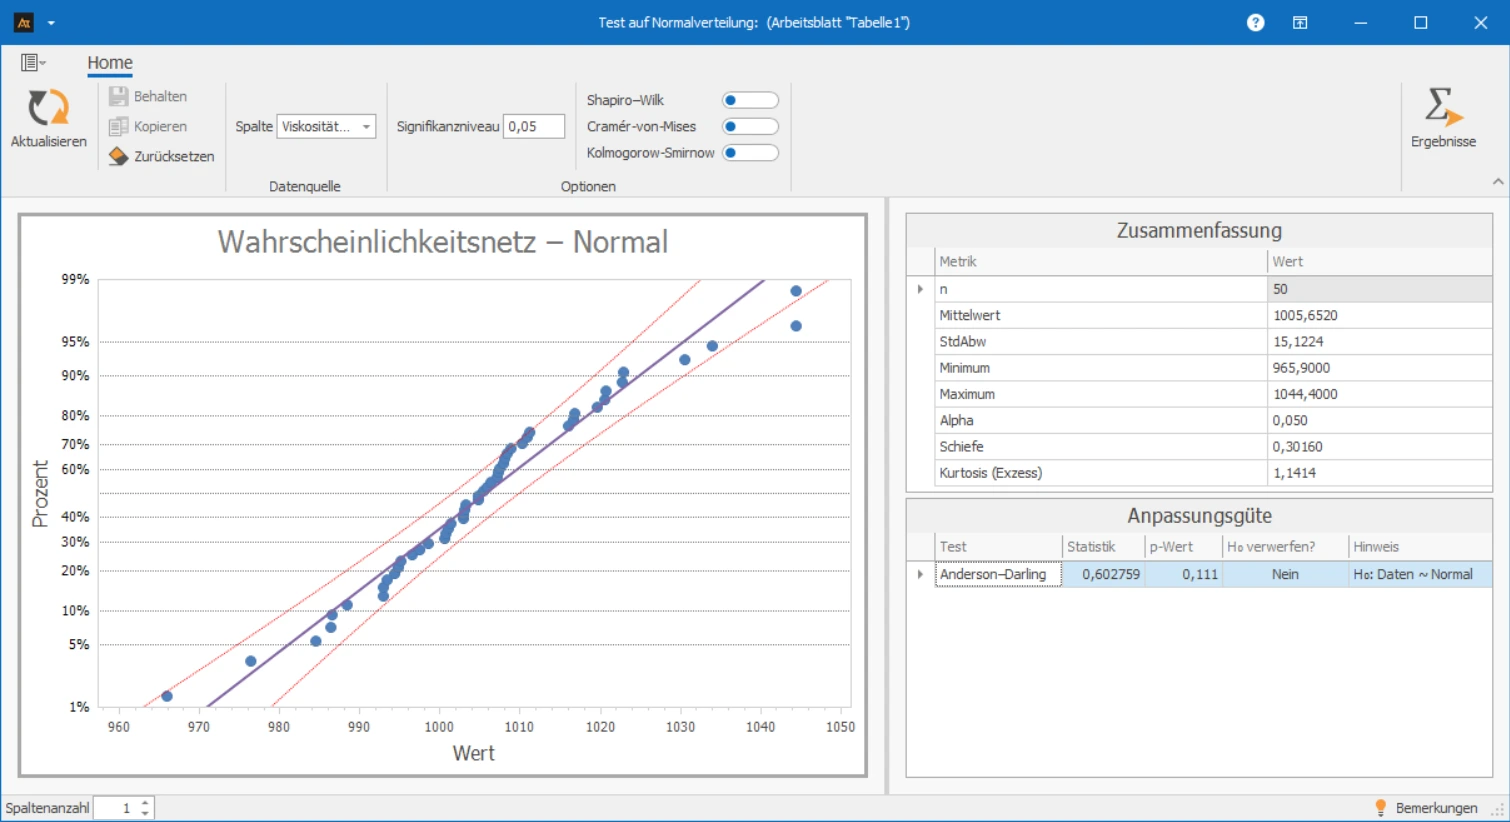
Probability Plot
The probability plot is a graphical aid to check whether the data approximately resemble a normal distribution. For this purpose, the measurements are sorted by size and compared with the values that would be expected in a perfect normal distribution.
- If the points are close to the line, the data behave like a normal distribution.
- If the points are far away or form a curve, this indicates a deviation (e.g., S-shapes, strong curvatures, or outliers).
One can imagine the line as a "template": The better the points fit on it, the more likely the data are normally distributed.
Anderson-Darling Test
In addition to the probability plot, there is also a statistical test: the Anderson-Darling test. This test checks mathematically whether the data fit a normal distribution and provides a p-value:
- p > 0.05: no indication of a deviation → the data can be considered approximately normally distributed.
- p ≤ 0.05: the test finds significant deviations → the data are considered not normally distributed.
Why often the Anderson-Darling test? It is particularly sensitive to deviations at the beginning and end of the distribution (where outliers are located). As a result, it more frequently detects anomalies than other tests and provides more reliable results in practice.
Preparation
- Select a continuous measurement variable and collect data (e.g., viscosity).
Usage in AlphadiTab
- In the Measure Phase, select the tool Test for Normal Distribution.
- Select the column “Viscosity”.
- Generate the chart with the button “Create New”.
Interpretation
- p-value > 0.05: No evidence of deviation from normal distribution.
- p-value ≤ 0.05: Evidence of deviation from normal distribution – check alternative distribution.
Example: Viscosity of Tomato Sauce
p-value = 0.111 → no evidence of deviation.
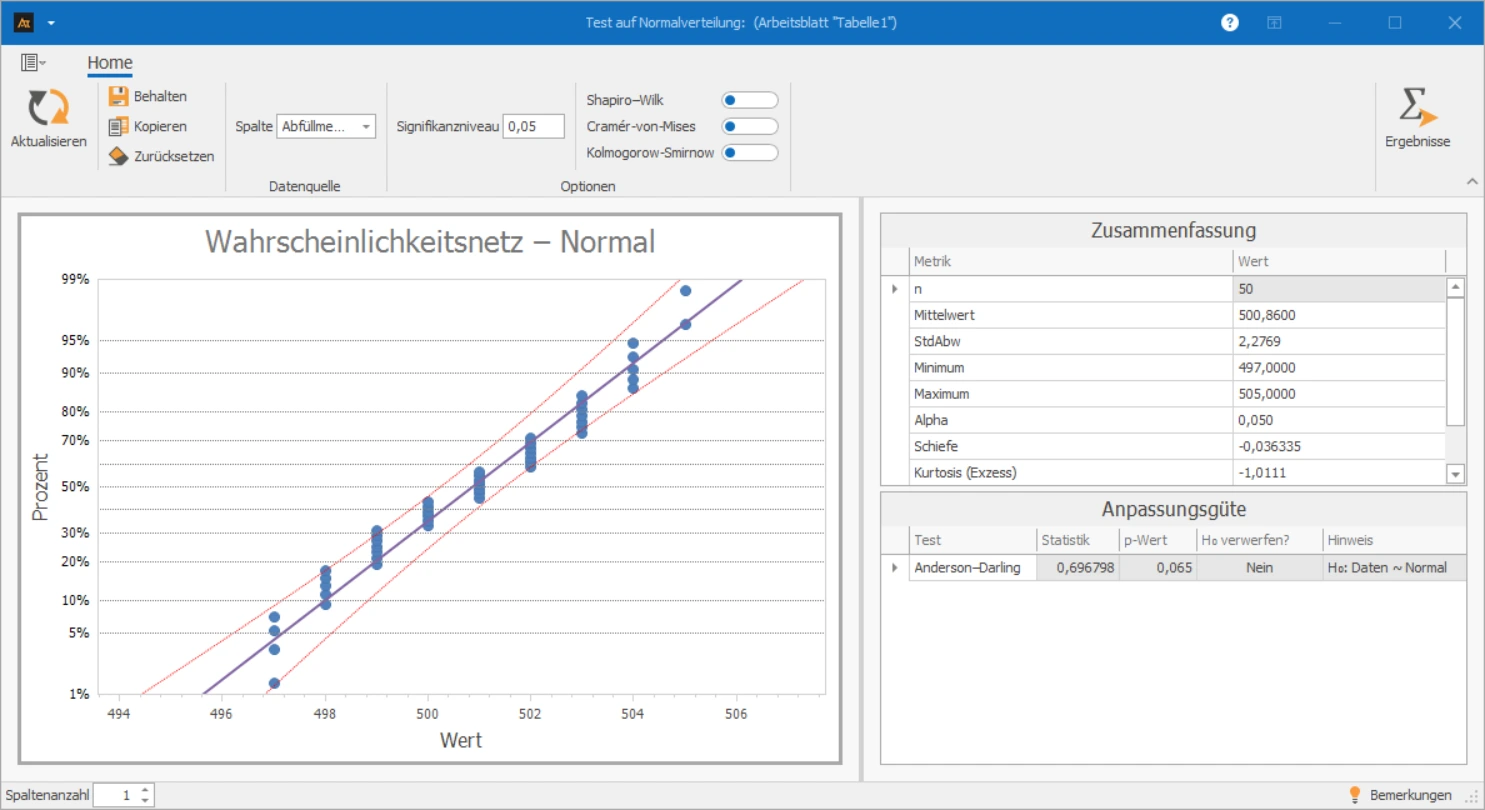
Example: Filling Quantity of Tomato Sauce
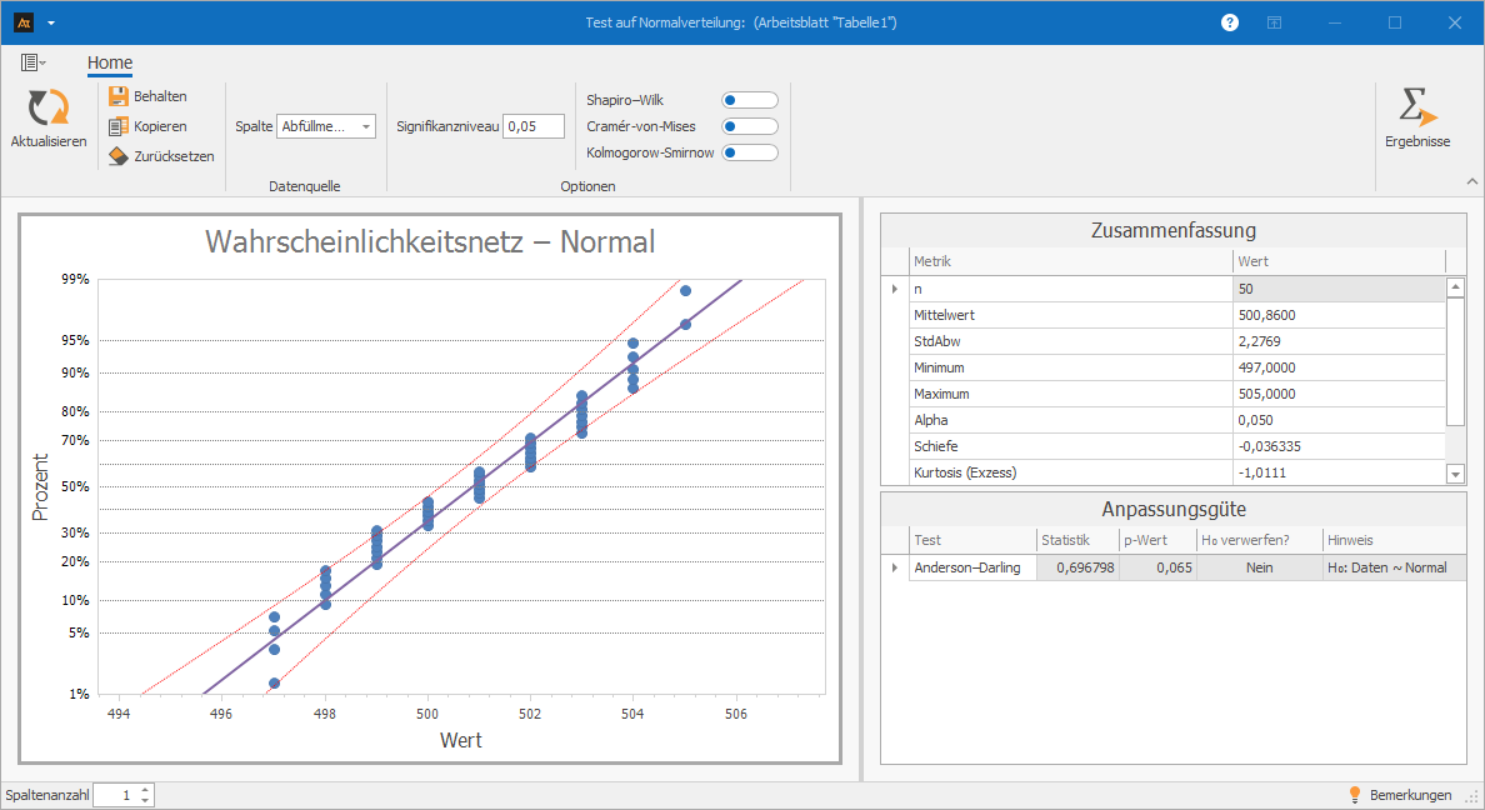
p-value = 0.065 → no evidence of deviation.
Example: Lead Time Goods Receipt
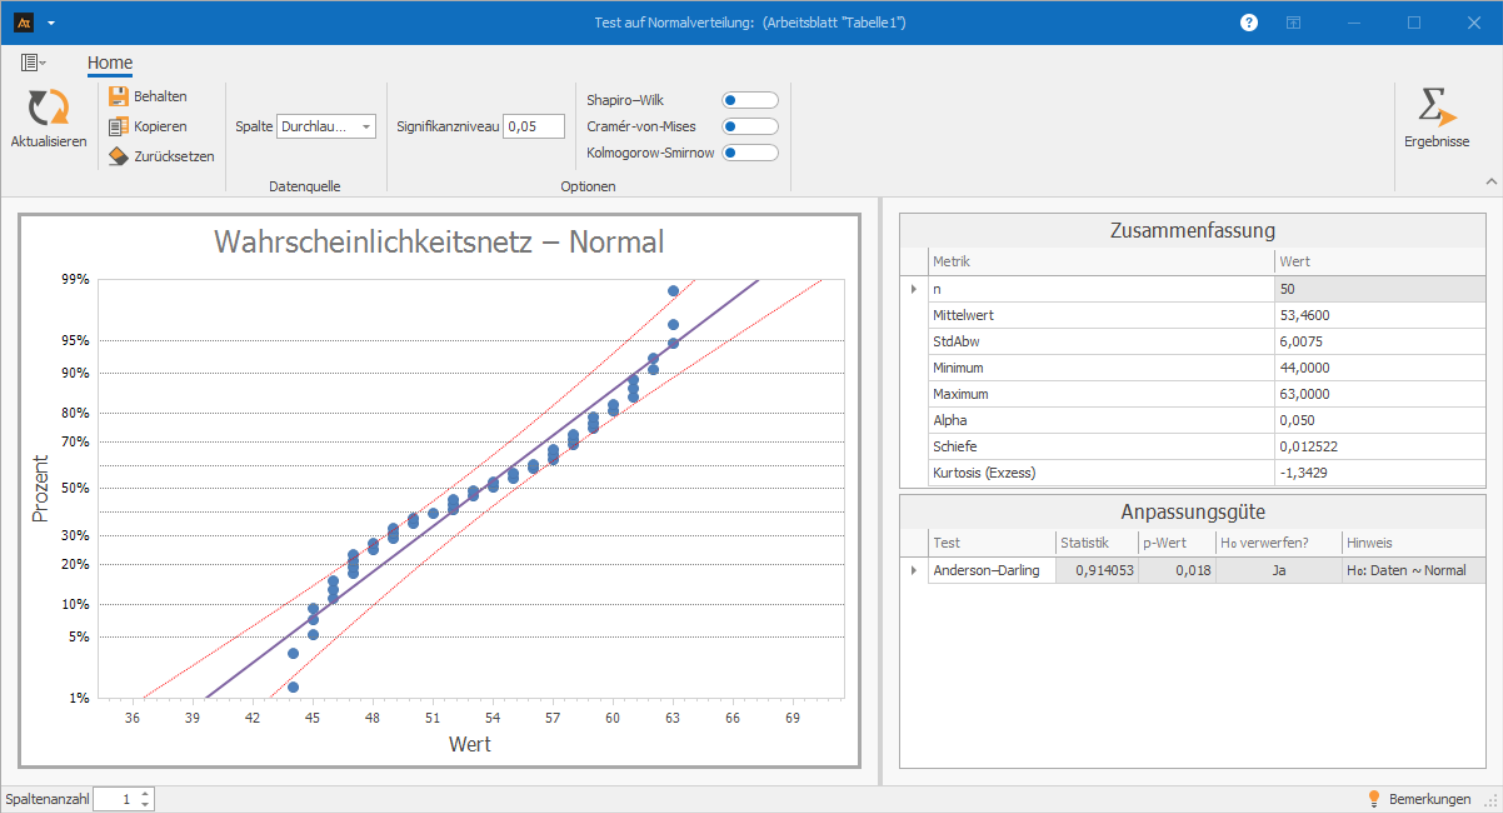
p-value ≤ 0.05 → deviation detected, data not normally distributed.
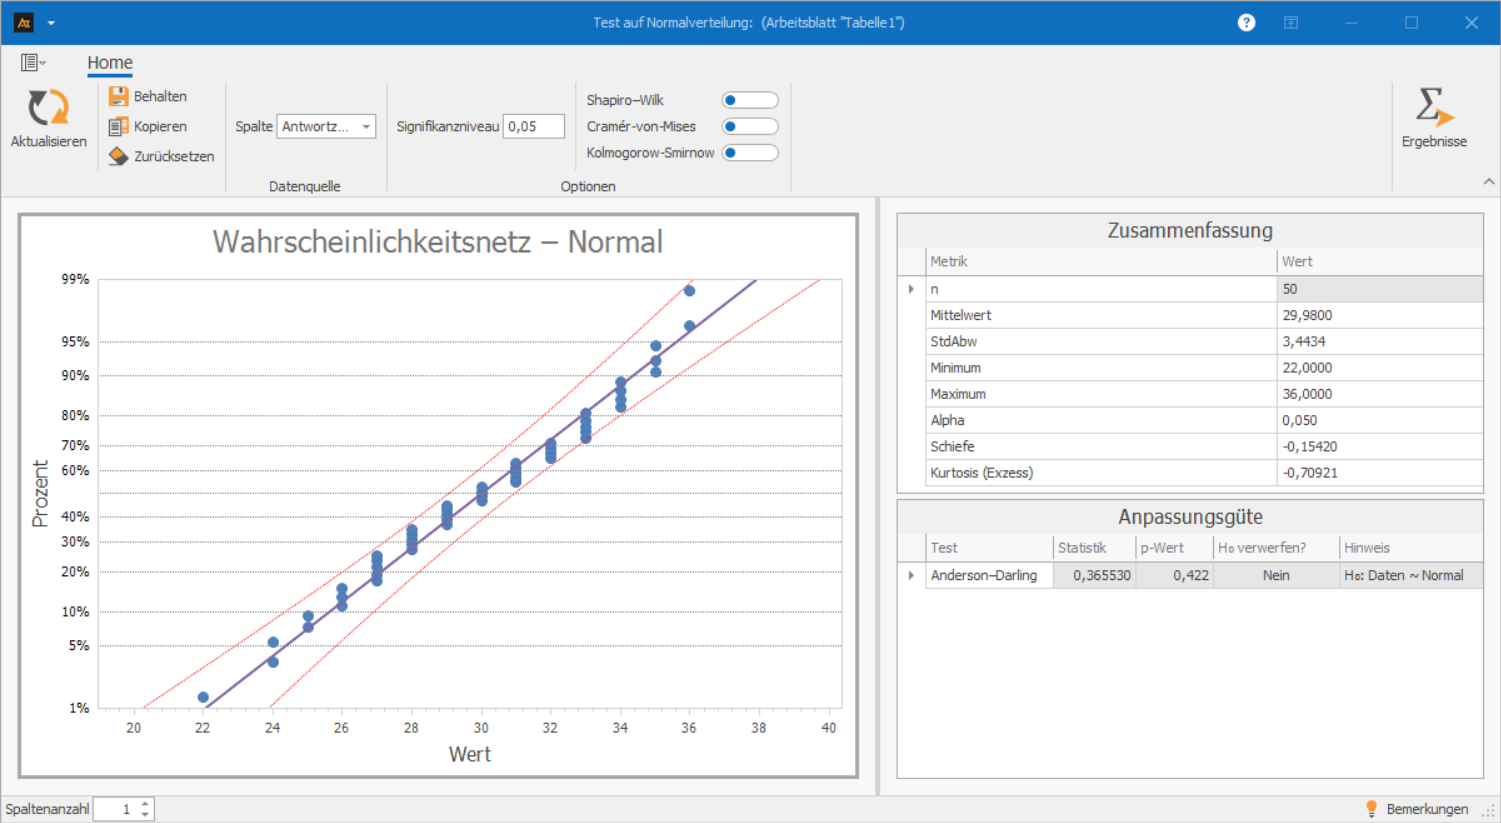
Example: Response Time IT Service
p-value large → data approximately normally distributed.
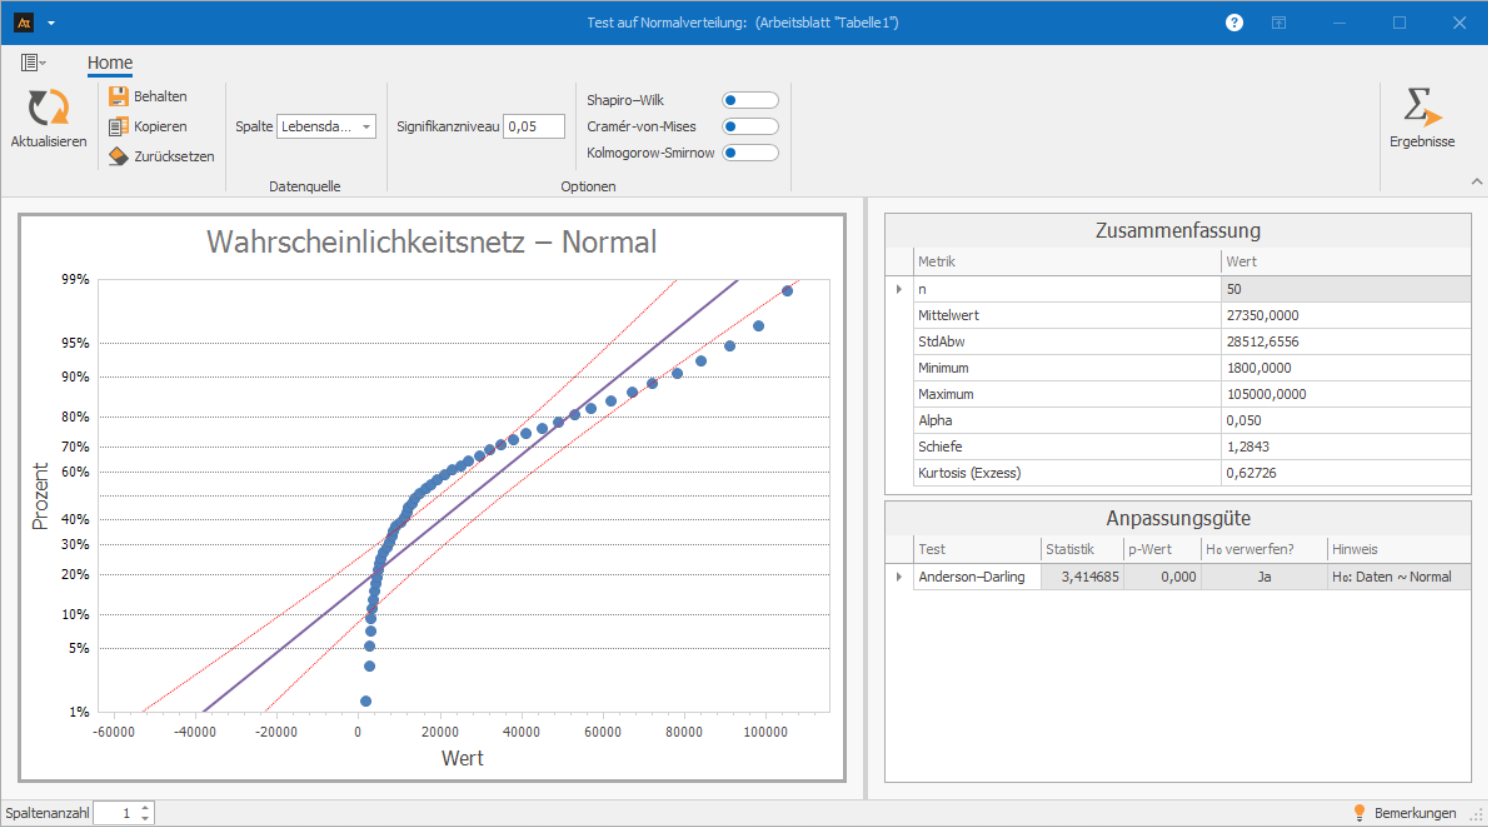
Example: Bearing Lifetime
p-value = 0.000 → data not normally distributed.
For nominal or ordinal data, a test for normal distribution is not meaningful, as these data types cannot be normally distributed by nature – a normal distribution requires continuous measurements.
Note: Discrete data (e.g., count data) can approximately follow a normal distribution with larger samples; however, whether this assumption holds should always be checked on a case-by-case basis.
Filling Quantity Tomato Sauce
The filling quantity of the tomato sauce is being examined – each filling should contain 500 ml. Before the quality of the filling process can be assessed, it is checked whether the measured filling quantities resemble a typical normal distribution.
Interpretation
In the probability plot, the data points mostly lie on the line. The Anderson-Darling test shows a p-value of 0.065 (> 0.05) – no evidence of a significant deviation. Visible frequency clusters are due to the resolution of the measuring instrument or rounded values and do not represent a distribution anomaly.
→ Data approximately normally distributed – usable for further analysis.
Processing Time of an Order
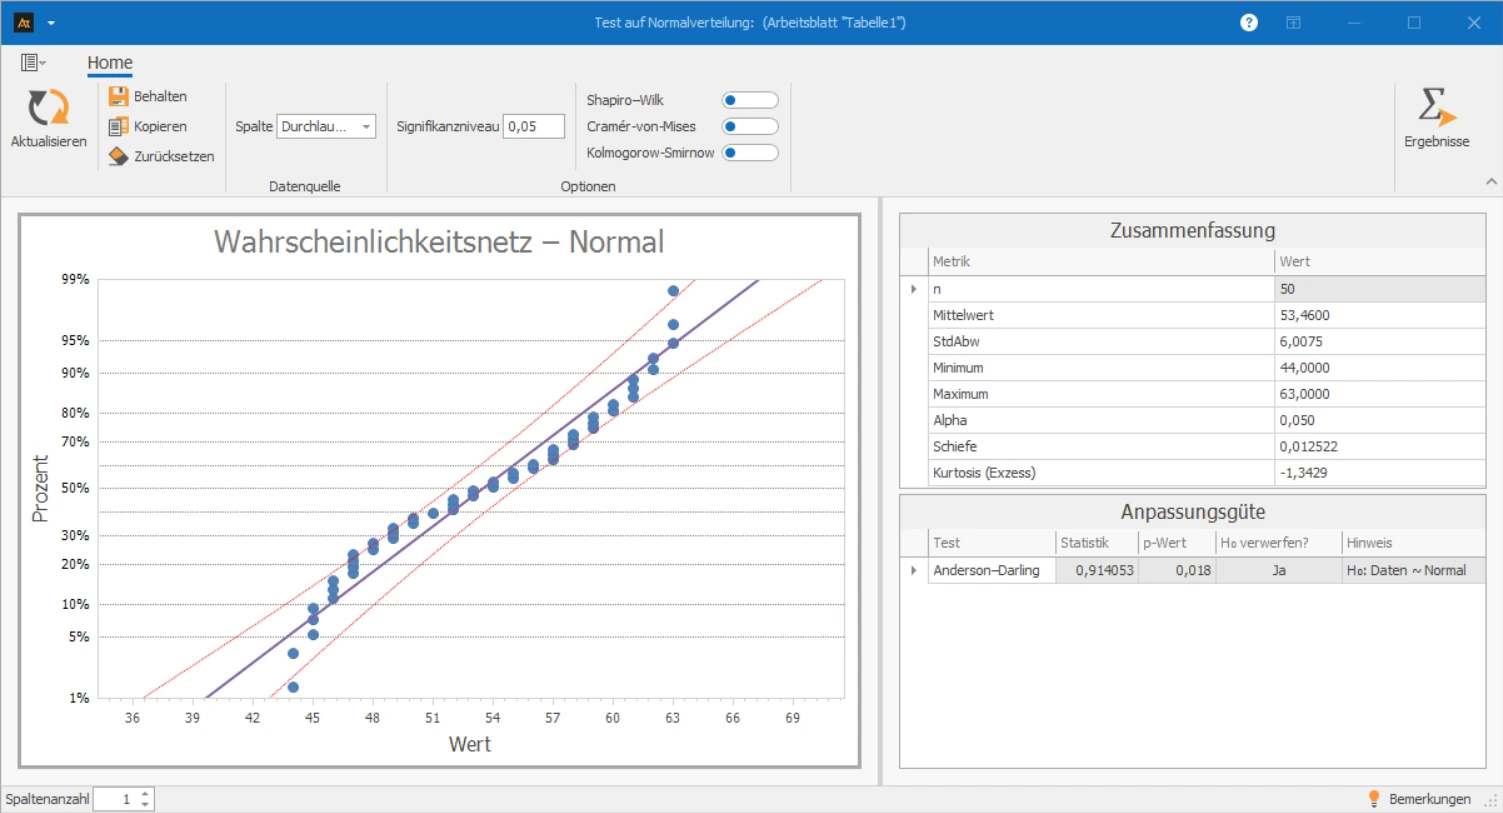
In goods receipt, each order goes through a verification step (checking delivery notes, recording items). Missing barcodes, incomplete delivery notes, or inquiries lead to very different processing times. It is checked whether the data is approximately normally distributed.
Interpretation
In the probability plot, the points deviate significantly from the line, especially in the lower and middle range. The Anderson-Darling test confirms this with a p-value of 0.018 (< 0.05). The null hypothesis of normal distribution is rejected.
→ Data not normally distributed.
Response Time Requests
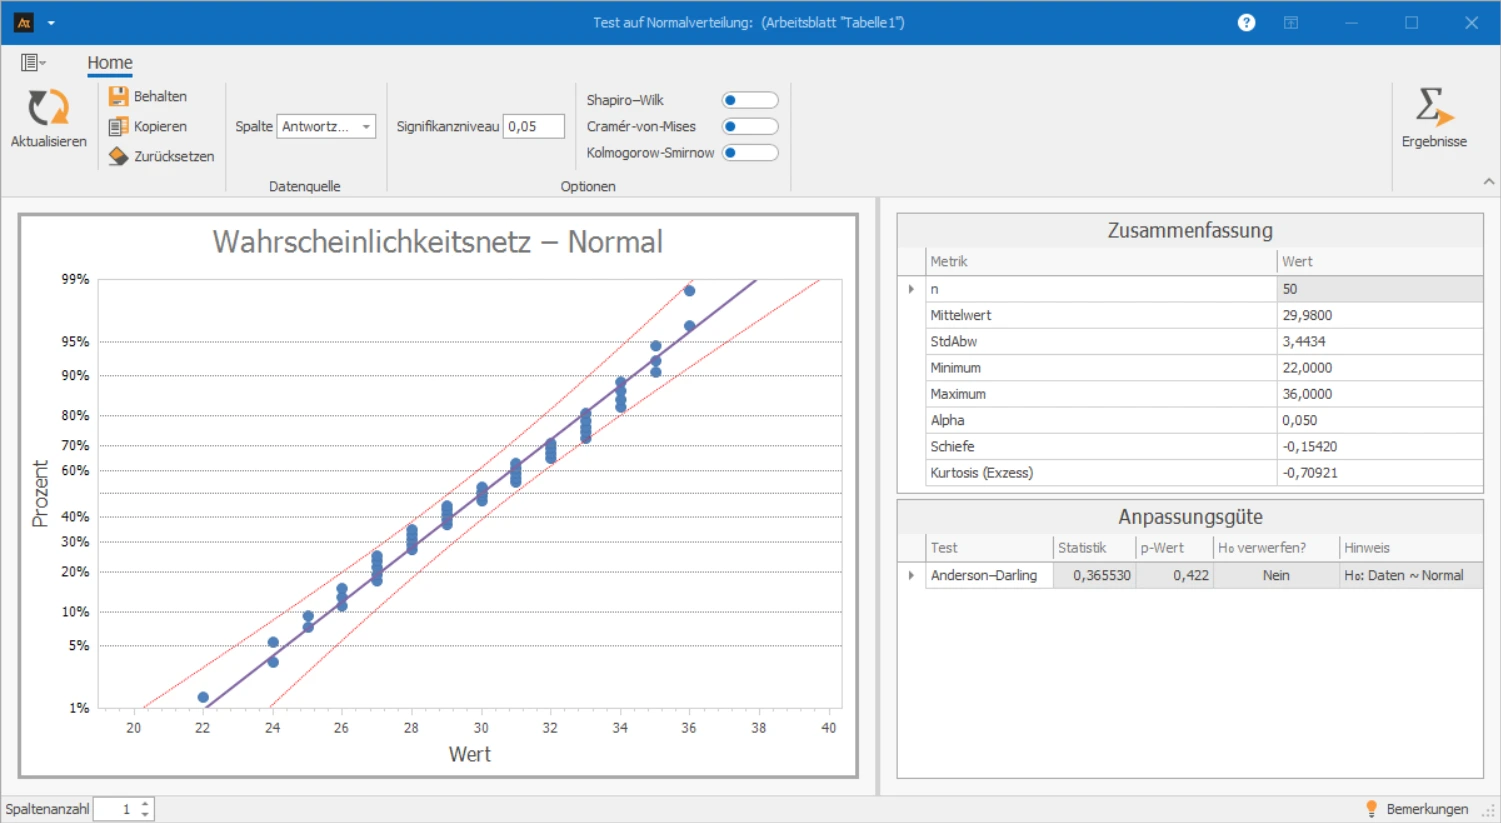
In the IT service desk, very different requests are received daily. Simple cases are processed quickly, more complex tickets are delayed – although the response time should not exceed 35 minutes. It is checked whether the data is approximately normally distributed.
Interpretation
In the probability network, the measurement points are mostly very close to the line, without systematic deviations. The Anderson-Darling test confirms this with a p-value of 0.422 (> 0.05).
→ Data approximately normally distributed.
Service life of ball bearings
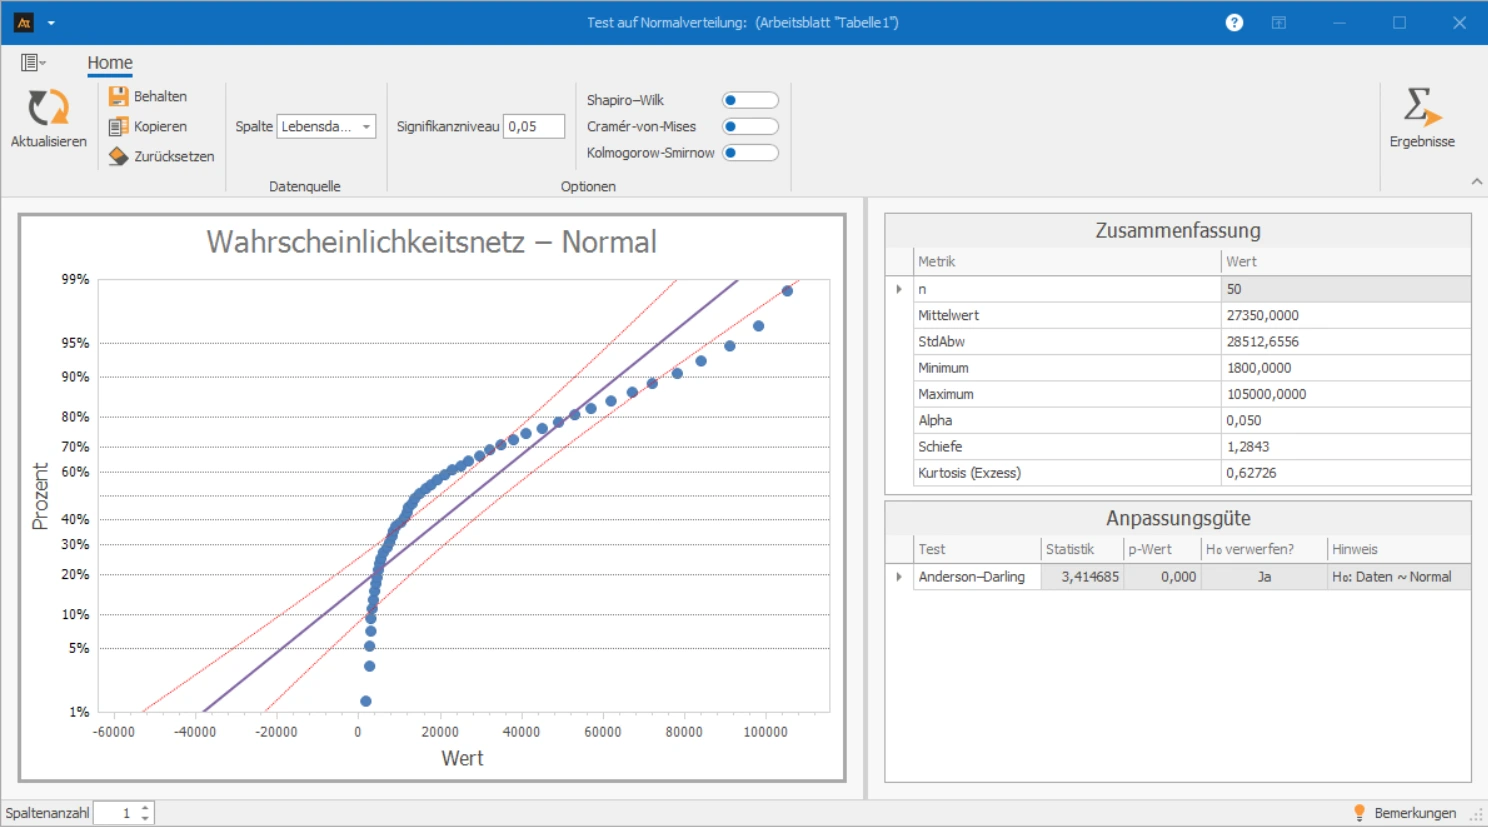
For a new type of machine, ball bearings are tested in continuous operation until they fail. This generates service life data to assess component reliability. It is checked whether the data is approximately normally distributed.
Interpretation
In the probability plot, the data points deviate significantly from the line. The Anderson-Darling test confirms this with a p-value of 0.000 (< 0.05) – the hypothesis of normal distribution is clearly rejected.
→ Data not normally distributed – use distribution-based evaluation (e.g., Weibull).
The normal distribution test is based on the Anderson-Darling test as implemented in the NMath package.