


The MSA Type 1 is used to assess the capability of a measuring instrument.
It checks whether a single measurement system measures sufficiently precisely (spread) and sufficiently accurately (location) in repeated measurements.
For this purpose, the indicators Cg (precision) and Cgk (precision + location) are used.
A measuring instrument is often considered capable if Cg and Cgk ≥ 1.33 (or according to specification).
Preparation
- Select a continuous measurement variable (e.g., viscosity).
- Select an appropriate measuring instrument to determine the measurement variable (e.g., rotational viscometer).
- Provide a reference part or a reference sample (e.g., homogenized tomato sauce).
- Ensure that the specification limits are known (LSL = 950, USL = 1050).
- Set measurement conditions and keep them constant during measurement (same sample, same temperature, one examiner; refer to the measuring instrument's reference manual).
- Plan and conduct a sufficient number of repeat measurements (e.g., 25 measurements).
 Use in AlphadiTab
- In the Measure phase, call the “MSA Type 1” function.
- Enter the “Viscosity” column in the data.
- Enter the reference value here 1000, at LSL 950 and at USL 1050.
- Perform MSA 1 by clicking the “Create New” button.
Interpretation
- First, check whether the measuring instrument is capable (capable if the Cgk value ≥ 1.33 or meets the required minimum value).
- Then determine whether the location or the spread of the measuring instrument (or both) need improvement.

In the production of tomato sauce, viscosity is regularly monitored as it has a significant impact on consistency, filling behavior, and product quality.
The permissible specification limits for viscosity are 950 to 1050.
Before further analyses are conducted, it should be checked whether the measuring instrument used to determine viscosity is suitable.
For this purpose, a homogenized tomato sauce is used as a reference sample in a Type 1 measurement system analysis.
The viscosity of the sample is measured multiple times with a rotational viscometer under constant conditions. The sample, measuring device, examiner, and temperature remain unchanged to exclusively evaluate the repeatability of the measuring instrument.
Based on the repeated measurements, it can be assessed whether the measuring instrument can reliably capture the viscosity of the tomato sauce within the specified limits and is thus suitable for further use in quality and process monitoring.
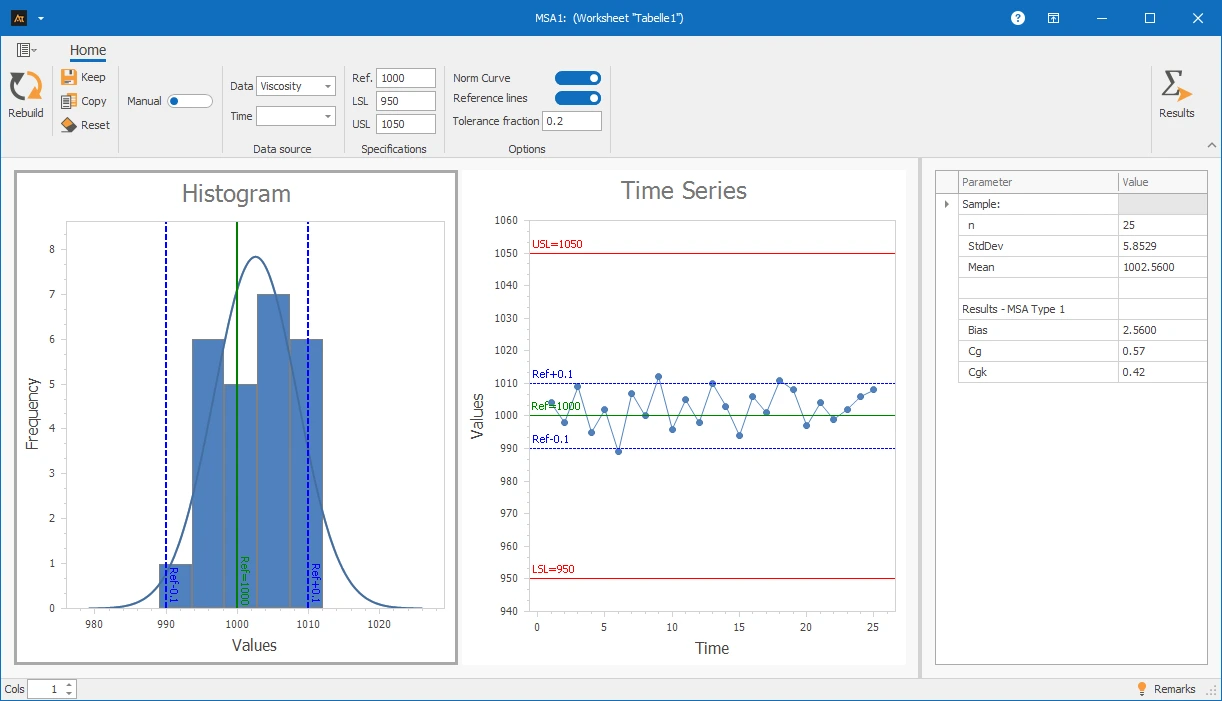
Interpretation of the results:
The Type 1 measurement system analysis shows that the measuring instrument is capable. The Cg value is 0.57 and the Cgk value is 0.42, which is below the required minimum value of 1.33.
The measuring instrument exhibits too much variation and shows a systematic deviation of 2.56.
Explanations of the graphics:
Histogram:
- The bars represent the frequency distribution of the measurements.
- The curve shows the normal distribution, calculated based on the mean and standard deviation of the measured actual data.
- The dashed blue lines represent the reference lines. They are determined from the reference value and the specified tolerance portion and are used to assess the variation of the measurement system in relation to the tolerance.
Time series chart:
- The red lines are the specification limits.
Filling Quantity Tomato Sauce
In the production of tomato sauce, the filling quantity is a central quality feature and is specified product-specifically in milliliters.
For the product, a target filling quantity of 500 ml is defined, with the specification limits USG = 480 ml and OSG = 520 ml.
The filling quantity is monitored in practice using a calibrated scale.
Since the measuring instrument records the weight, the measurement system analysis Type 1 is carried out based on the weight data. Since this is a fictional example, it is assumed for simplicity that 1 ml of tomato sauce corresponds to 1 g.
As part of the MSA Type 1, a stable reference container is weighed multiple times under constant conditions (same container, same scale, one inspector).
The goal is to check whether the measuring instrument used can capture the filling quantity sufficiently precisely and without relevant systematic deviation.
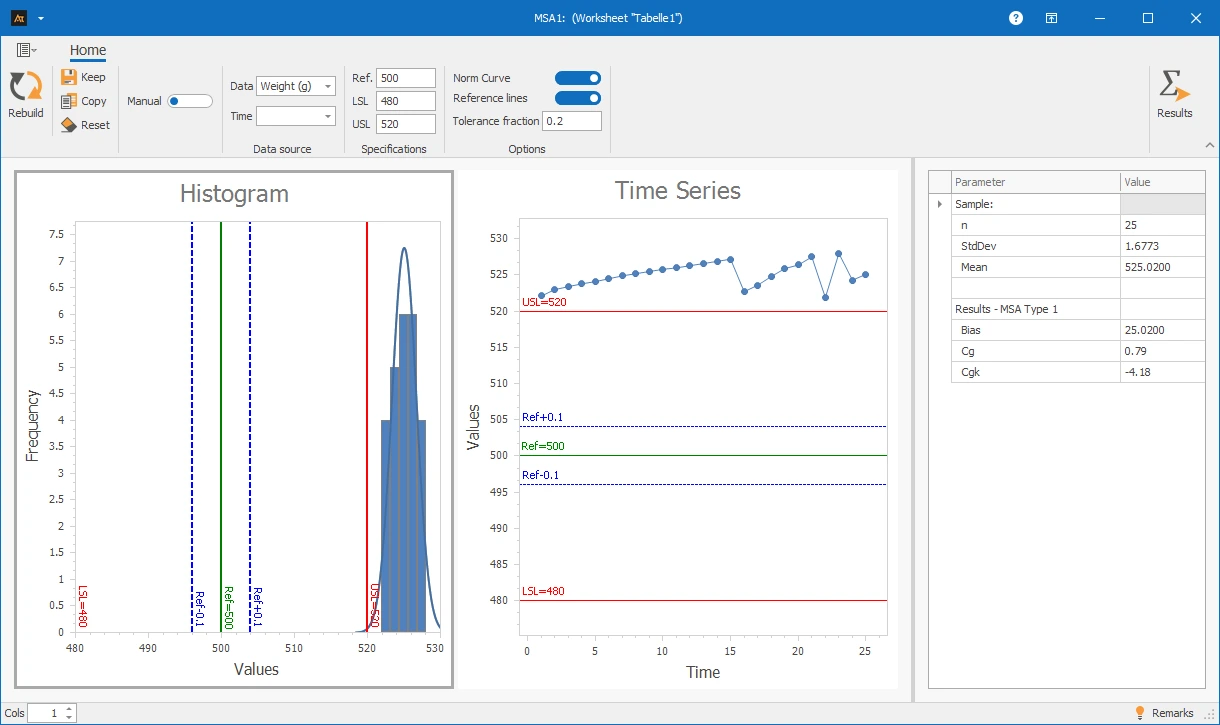
In the evaluation, a Cg value of 0.79 and a Cgk value of -4.18 are obtained. Both values are below the frequently required reference value of 1.33.
Interpretation
The measuring instrument is not capable.
Lead time of an order in goods receipt
The lead time in goods receipt is determined from timestamps of the IT system, for example from the time of physical goods receipt and the completion of booking in the system.
The time values are thus not collected with a classic measuring instrument but are generated by the system.
For this reason, a formal measurement system analysis (MSA Type 1 or Type 2) is not applicable for lead times in goods receipt.
In particular, there is no measuring instrument in the classical sense.
Nevertheless, it makes sense to apply the mindset of measurement system analysis to this data.
It should be checked whether timestamps are set with delay, whether bookings are made collectively, or whether there are system-related time shifts.
Only when these influences are known can lead times be correctly interpreted and assigned to the process.
Response Time Requests
The response time in the IT helpdesk is calculated from the timestamps of the ticket system, such as from the ticket opening and the first documented response.
Here, too, these are automatically recorded time data and not measurements from a physical measuring instrument.
Therefore, a classic measurement system analysis is not directly applicable, as neither a measuring instrument nor inspectors are considered in the sense of the MSA.
Nevertheless, it makes sense to consider the basic principles of measurement system analysis.
For example, automatic status changes, manual rework, or time shifts in the system can affect the measured response time.
Examining such systematic effects helps to correctly classify deviations and avoid misinterpretations of process performance.
Continuous data: Data collected with a measuring instrument that can have both units and decimal places.
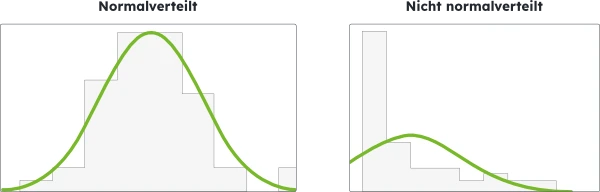
Normally distributed data: Data that can be well described by a normal distribution. This can be checked, for example, with a test for normal distribution.
OSG = OTG = Upper specification or tolerance limit: The maximum permissible value for the target variable. If a measurement value is above this, it is considered not okay.
USG = UTG = Lower specification or tolerance limit: The minimum permissible value for the target variable. If a measurement value is below this, it is considered not okay.
Cg: Capability index that evaluates the dispersion of the measuring instrument in relation to the specification limits.
Cgk: Capability index that evaluates both the dispersion and the position of the measuring instrument in relation to the specification limits.
Bias (position deviation): Systematic deviation of the mean value of the measurements from the reference value.
Reference value: Given or known target value with which the mean value of the measurements is compared.
x̄ = Sample mean: Average value of the collected data.
s = Sample standard deviation: Measure of the dispersion of the data around the mean.