


The Voice of Business is used to systematically capture the requirements of the internal business and convert them into measurable sizes.
It reflects the perspective of internal departments such as sales, production, or logistics and ensures that a project is also relevant from a corporate perspective.
The Voice of Business thus serves as central legitimacy for a project. If there is no interest or no measurable pain in the business, the project is not important for the company.

Rework (Voice from Production)
The production department reports high internal error rates. These lead to increased rework costs, which are recorded as measurable metrics.
-
Business Voice: “Due to the many complaints, we always have to rework.”
-
CBR: Current: 20,000 € / month; Target: < 5,000 € / month
-
Data Type: Continuous
Delivery Performance (Voice from Sales)
Sales criticizes insufficient delivery performance. This is represented by the OTIF (On Time In Full) metric.
-
Business Voice: “Our delivery performance is getting worse.”
-
CBR: Current: 65%; Target: > 90%
-
Data Type: Continuous
Revenue Loss (Voice from Sales)
Due to lack of capacity and insufficient performance, customers order less. This leads to measurable revenue losses.
-
Business Voice: “Due to the many reworks, we lose capacity and thus revenue.”
-
CBR: Current: 2 million €; Target: 2.5 million € next year
-
Data Type: Continuous

Preparation
- Obtain internal feedback from relevant departments with key figures
- Identify which existing key figures can be influenced or improved by the project.
- Compare the current actual value of the key figure with the target value
 Use in AlphadiTab
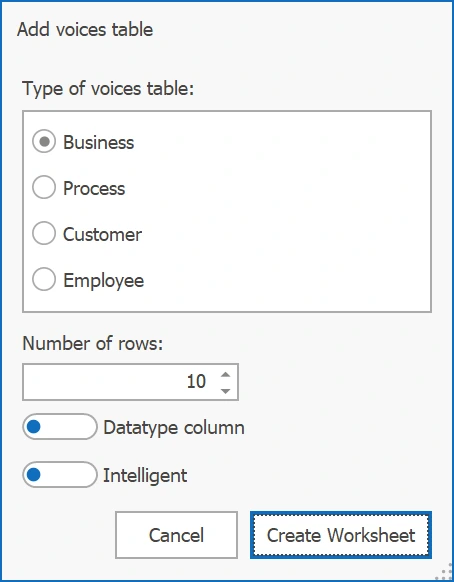
- Select the "Voice of Business" tool in the Define phase.
- Determine the number of rows and the desired data types.
- Generate the worksheet by "Create Worksheet".
- Enter the business voice and the derived measure from it.
Interpretation
- Are measures or projects required to achieve the target values.
- Involvement of relevant internal stakeholders, such as department heads or process teams
- Access to existing key figures and economic indicators
Voice of Business (VOB): Unvarnished internal pain of the department.
Rework costs: Costs incurred due to error corrections in production
(Example: Actual 20,000 € vs. Target < 5,000 €)
OTIF (On Time In Full): Metric for evaluating delivery performance
(Example: Actual 65% vs. Target > 90%)
Revenue: Total earnings within a defined period
(Example: Actual 2 million € vs. Target 2.5 million €)
Continuous data type: Data type for continuously measurable values such as costs, time, or percentages
The bar chart can be used in LSS projects in all DMAIC phases. However, the purpose differs depending on the phase. In the Define phase, it is primarily used for prioritizing problems. In the Measure phase, it helps to identify noticeable influencing factors. In the Analyze phase, these anomalies are further investigated to narrow down possible root causes. In the Improve phase, the bar chart is used to evaluate the effectiveness of solutions. In the Control phase, it helps to verify the sustainability of the improvement.
Prioritizing Problems
In the Define phase, the bar chart is used for prioritization. When there are multiple problems, types of errors, or reasons for complaints, it can be made visible which focus occurs most frequently or causes the greatest impact. This allows determining which topic should be addressed first in the project.
Identify Influencing Factors
In the Measure phase, the bar chart is used to investigate possible influencing factors on the prioritized problem. By comparing categorical features, it becomes visible in which groups, areas, or conditions there are noticeable differences. The purpose here is to identify relevant influencing factors and narrow them down for further analysis.
Narrow Down Root Causes
In the Analyze phase, the anomalies identified in the Measure phase are further investigated. Possible causes — for example, from an Ishikawa diagram — are examined one level deeper and further narrowed down with the bar chart. The purpose here is to work out the most likely root causes from noticeable influencing factors.
Evaluate Effectiveness of Solutions
In the Improve phase, the bar chart is used to evaluate the effectiveness of solutions. After implementing a measure, it can be checked whether the noticeable influencing factors improve initially and whether this subsequently also positively affects the original problem. This makes it visible whether the chosen solution is actually effective.
Verify Sustainability of Improvement
In the Control phase, the bar chart is used to verify the sustainability of the improvement. It can be reviewed again whether the previously noticeable categories have remained stable and whether the achieved improvement still exists. This allows evaluating whether the implemented solution remains effective in the long term.