


The Cause-&-Effect Matrix is used to evaluate possible influencing factors (Causes or Inputs), which are often collected from one or more Ishikawa diagrams, against some groups of factors (Effects).

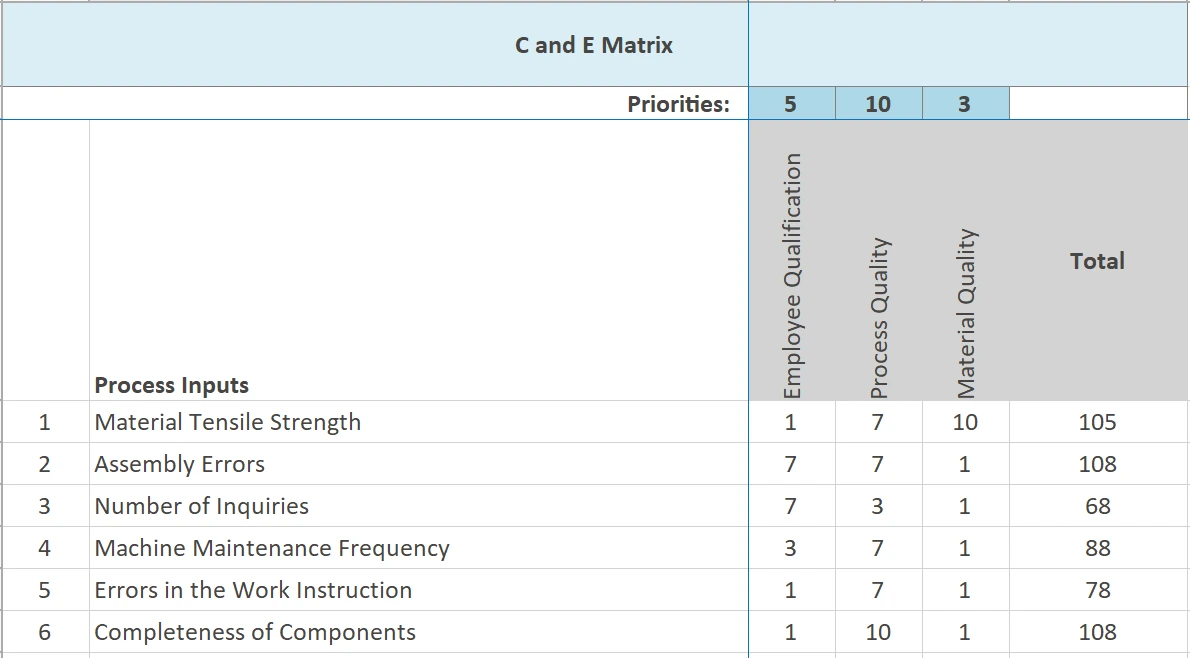
In this example, various influencing factors from an Ishikawa diagram were defined as process inputs to determine the impact these inputs have on the three groups Employee Qualification, Process Quality, and Material Quality.
Interpretation of the Results
The matrix shows that the completeness of the components (108), followed by assembly errors (108) and the tensile strength of the material (105), have the greatest influences on the three effects.
 Usage in AlphadiTab
- Select the tool "C&E Matrix" in the Analyze Phase.
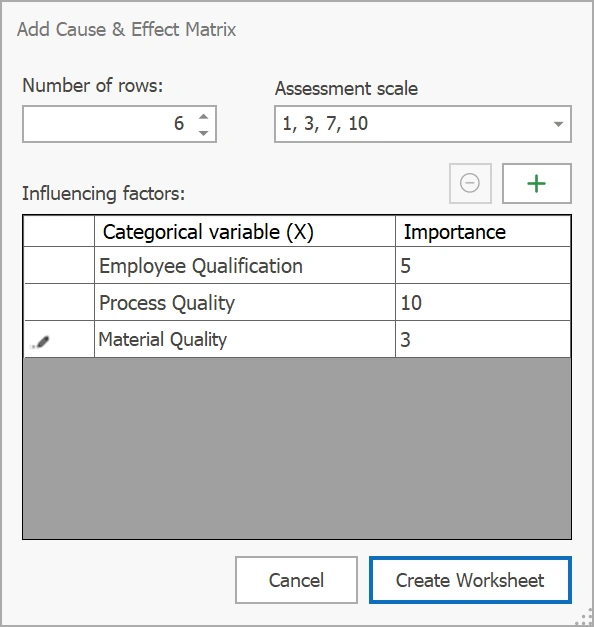
- Define the number of categorical variables with the "+" and specify their names and significance for the overall project.
- Define how many rows or influencing factors, e.g., from the Ishikawa, are needed as inputs (here 6 rows).
- Then set the rating scale, i.e., which ratings are available to you. It is helpful to select only a few so that you have to make a decision when rating.
- Then press "Create Worksheet", and the sheet will be created in AlphadiTab. You can start rating row by row.
For conducting a Cause & Effects Analysis, it is important that the input factors are adjustable.
Inputs = Influencing factors (e.g., from one or more Ishikawa diagrams)
Categorical X = Groups of influencing factors
Importance = Importance (influence) of the categorical variable on the overall project