


The Type 2 attribute measurement system analysis is used to assess the suitability of an evaluation system when results are recorded as categories rather than continuous measurements.
Typical examples are evaluations such as good/bad, i. O./n. i. O., passed/not passed, or Hot/Warm/Cold.
The focus is on the repeatability and reproducibility of the evaluations. Repeatability means that the same inspector classifies the same part the same way upon repeated evaluation. Reproducibility means that different inspectors evaluate the same part the same way.
If a standard or expert evaluation is available, it is additionally checked whether the inspectors' evaluations match this reference.
Thus, the MSA Type 2 attribute answers three central questions:
- Does an inspector evaluate the same upon repetition?
- Do different inspectors evaluate the same?
- Do the evaluations match the technically correct standard?
For the MSA Type 2 attribute, the visual inspection of the labels on filled tomato jars is examined. Several employees assess whether the label is correctly applied.
The evaluation is carried out in two states:
| State | Meaning |
|---|---|
| g | Label is correctly positioned, readable, and undamaged |
| s | Label is crooked, damaged, unreadable, missing, or incorrectly applied |
For the analysis, 50 tomato jars from the ongoing production are selected. Three inspectors evaluate each jar twice. Additionally, an experienced quality inspector sets a reference evaluation as a standard for each jar.
The data is then evaluated in AlphadiTab with the MSA Type 2 attribute.

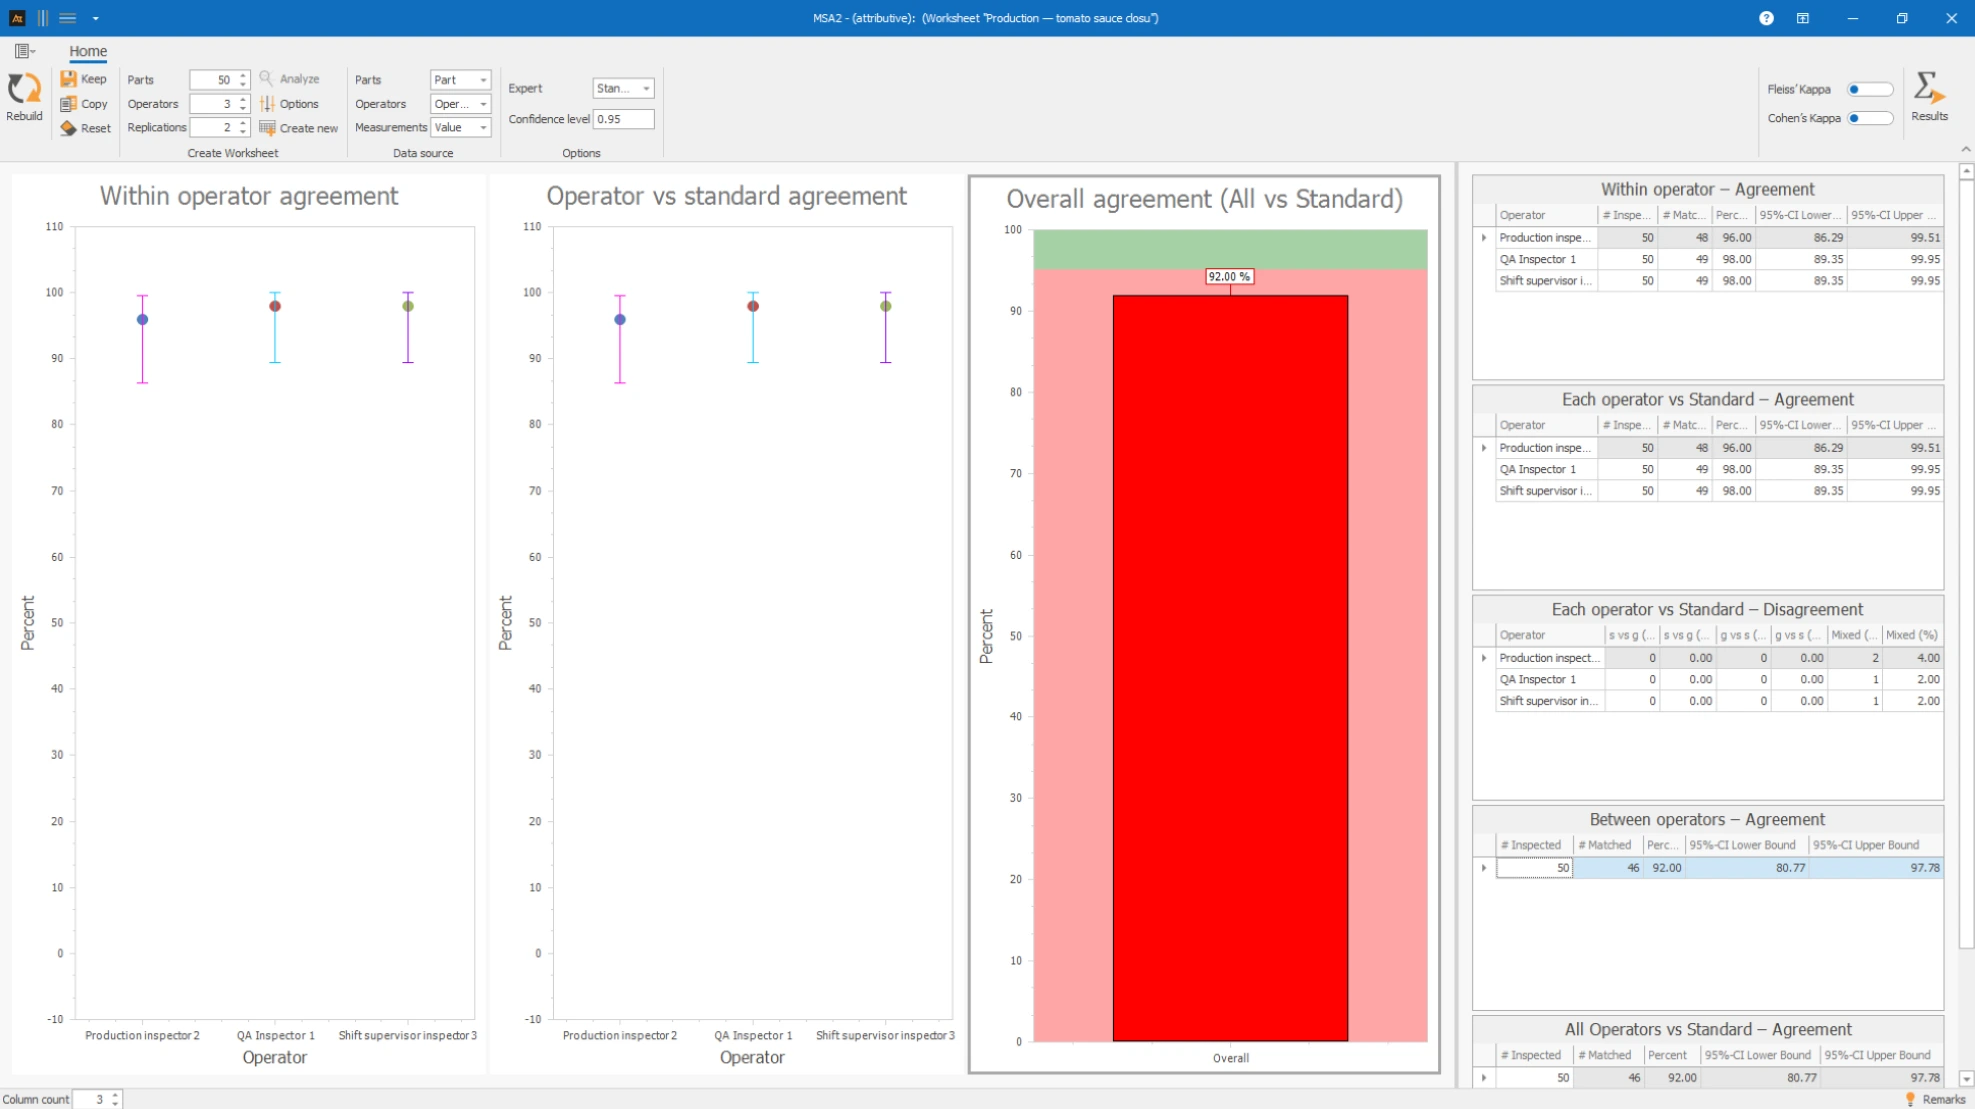
Interpretation:
The analysis shows whether the label inspection is consistent and repeatable. A high agreement means that the inspectors apply the criteria for g and s comparably. If the overall agreement is below 95 %, the inspection criteria should be sharpened, borderline cases defined, and the inspectors calibrated together.
Left Image
The left chart shows the agreement within the examiners.
- Each bar represents an examiner or operator.
- The bar height shows the proportion of parts where the examiner gave the same rating in their repetitions.
- The error bars show the 95% confidence interval.
A high agreement means that the examiner can reliably repeat their own assessment. Low values indicate uncertain assessment criteria, difficult borderline cases, or a need for training.
Middle Image
If a standard or expert assessment was provided, the middle chart shows the agreement of each examiner with the standard.
- Each bar represents an examiner compared to the standard.
- The bar height shows the proportion of parts where all ratings of this examiner match the standard.
- The error bars show the confidence interval of this agreement.
This chart is particularly important when it is known which assessment is technically correct. An examiner can be very repeatable internally but still systematically deviate from the standard.
Right Image
The right chart shows the overall agreement summary as a traffic light.
- With standard: Overall agreement of all examiners with the standard.
- Without standard: Overall agreement between the examiners.
- Green: Overall agreement at least 95%.
- Red: Overall agreement below 95%.
The traffic light is a quick decision aid. However, it does not replace the detailed analysis of individual examiners and the kappa statistics.
AlphadiTab presents the results in several tables. Depending on the settings, Fleiss' Kappa and Cohen's Kappa can also be displayed.
Within operator – Agreement
This table evaluates the repeatability within each inspector. It shows how many parts were inspected, how many parts the repetitions match, and what the percentage is including the 95% confidence interval.
Each operator vs Standard – Agreement
This table is displayed when a standard or expert column is present. It shows for each inspector how often their ratings completely match the standard.
Each operator vs Standard – Disagreement
This table shows the type of deviations from the standard. In a g/s rating, it means:
- s vs g: A good part is rated as bad.
- g vs s: A bad part is rated as good.
- Mixed: An inspector rates the same part differently in repetitions.
Between operators – Agreement
This table shows the proportion of parts where all inspectors come to the same rating. It is also calculated when no standard is present.
All Operators vs Standard – Agreement
This table summarizes the agreement of all inspectors with the standard. If a standard is present, it forms the basis for the traffic light.
Fleiss’ Kappa and Cohen’s Kappa
In AlphadiTab, in addition to the percentage agreements, Kappa statistics can also be displayed. Kappa statistics take into account that part of the agreement can also occur by chance.
Values close to 1 indicate very good agreement. Values close to 0 mean that the agreement is hardly better than random. Negative values indicate worse agreement than would be expected by chance.
Fleiss’ Kappa is mainly used when there are multiple raters or multiple ratings per item. Cohen’s Kappa is used for comparisons between two ratings. In AlphadiTab, Cohen’s Kappa is only output if the necessary data conditions are met.
The Kappa values should be considered in addition to the percentage values, especially when the categories are unevenly distributed.
Preparation
- Select an attribute evaluation characteristic, for example, part good/bad.
- Clearly define the allowed response categories.
- Select multiple parts that cover the relevant evaluation range.
- If possible, establish a technically correct standard through expert decision.
- Select multiple inspectors who also perform the evaluation in everyday life.
- Determine the number of repetitions per inspector, typically two repetitions.
- Keep evaluation conditions, inspection instructions, and tools constant.
- Create the worksheet for the MSA type 2 attribute. This can be done directly in AlphadiTab.
- Conduct evaluations: The order of the parts should be random if possible; repetitions of an inspector should be temporally separated.
 Use in AlphadiTab
- In the Measure Phase, call the function MSA Type 2 Attribute.
- In the Operator column, specify the inspector.
- In the Part column, specify the part or case number.
- In the Measurements column, select the attribute evaluation.
- Optionally, in the Expert column, select the known standard or expert evaluation.
- Set the confidence level, typically 0.95.
- Optionally, display Fleiss' Kappa and/or Cohen's Kappa.
- Confirm with Update.
Interpretation
- Total agreement ≥ 95 %: The evaluation system is generally acceptable.
- Agreement within the inspector: The inspectors evaluate the same part equally.
- Agreement inspector vs. expert: The inspectors evaluate technically correctly compared to the standard.
- Agreement among inspectors: The inspectors come to the same evaluations among themselves.
- Additionally check Kappa values: Especially important with unbalanced distribution of categories.
Visual Inspection Tomato Sauce - Machine A, Machine B, and Machine C
In production, packaged products are inspected after sealing. It should be investigated whether multiple inspectors evaluate the same seal seams consistently.
The evaluation is carried out in two states:
| State | Meaning |
|---|---|
| i. O. | Seal seam is completely closed, uniform, and without visible defects |
| n. i. O. | Seal seam is open, damaged, dirty, wrinkled, or incompletely closed |
For the MSA Type 2 attribute, three inspectors evaluate the same packages twice each. Additionally, an experienced quality inspector sets a reference evaluation as a standard for each package.
Worksheet Informations
The worksheet was prepared in AlphadiTab. The standard values for the number of parts, number of inspectors, and repetitions were adopted and then a worksheet was created with "New". In this worksheet, the evaluations of the inspectors are documented.
Subsequently, the analysis is carried out in AlphadiTab. The columns for Part, Operator, Measurement, and Expert are automatically recognized if the worksheet was previously created in AlphadiTab.
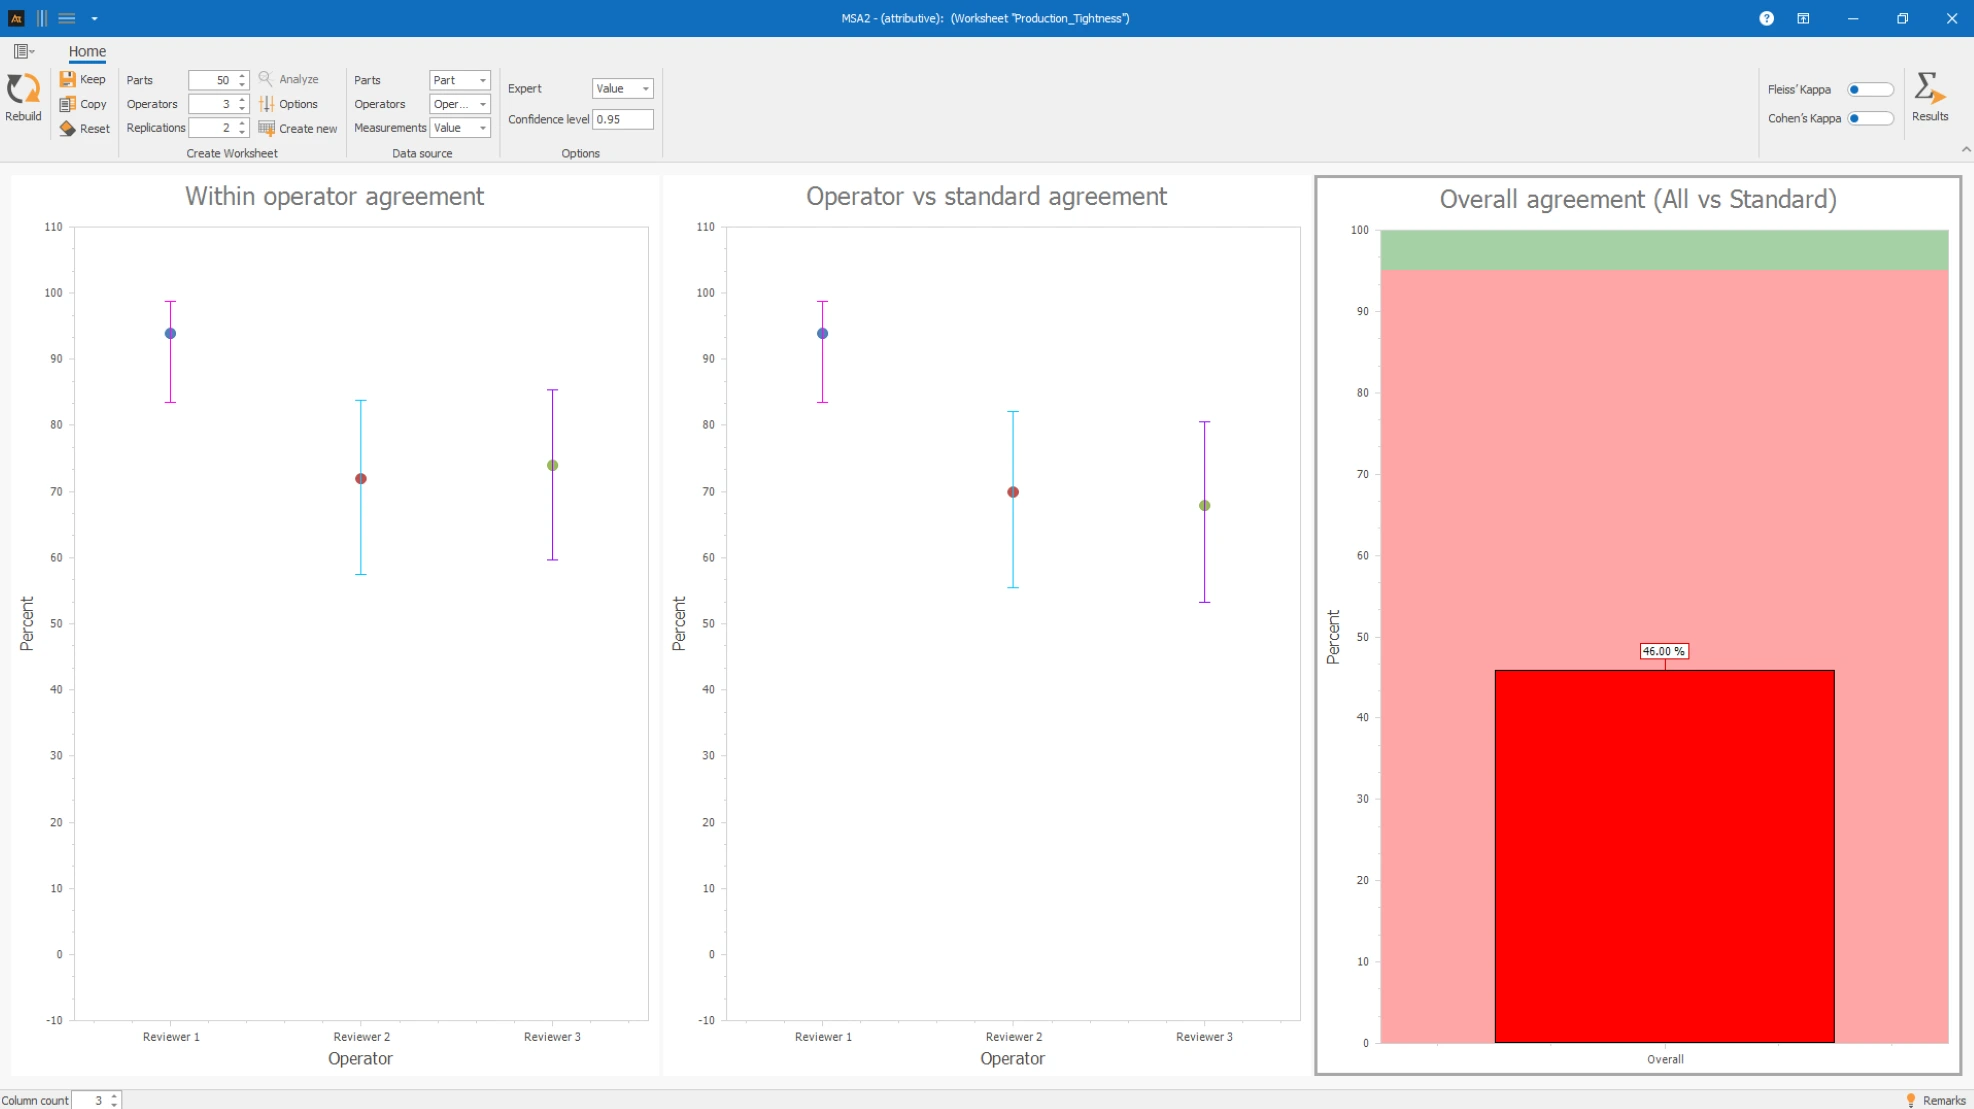
Interpretation:
The MSA Type 2 attribute shows that the seal seam inspection is not sufficiently reliable. The overall agreement is only 42% and thus significantly below the required threshold of 95%.
The evaluation system is not suitable in this form. The inspectors do not apply the criteria for i. O. and n. i. O. consistently enough or deviate from the standard.
As measures, typical error patterns should be defined, limit samples established, and the inspectors jointly trained or calibrated. Subsequently, the MSA should be repeated.
Ticket classification in the Helpdesk
In the IT service desk, incoming tickets are classified, for example, as incidents, service requests, or access requests. It should be checked whether multiple helpdesk employees classify the same tickets consistently.
Several helpdesk employees evaluate the same sample tickets twice each. An experienced IT coordinator sets the standard classification for each ticket.
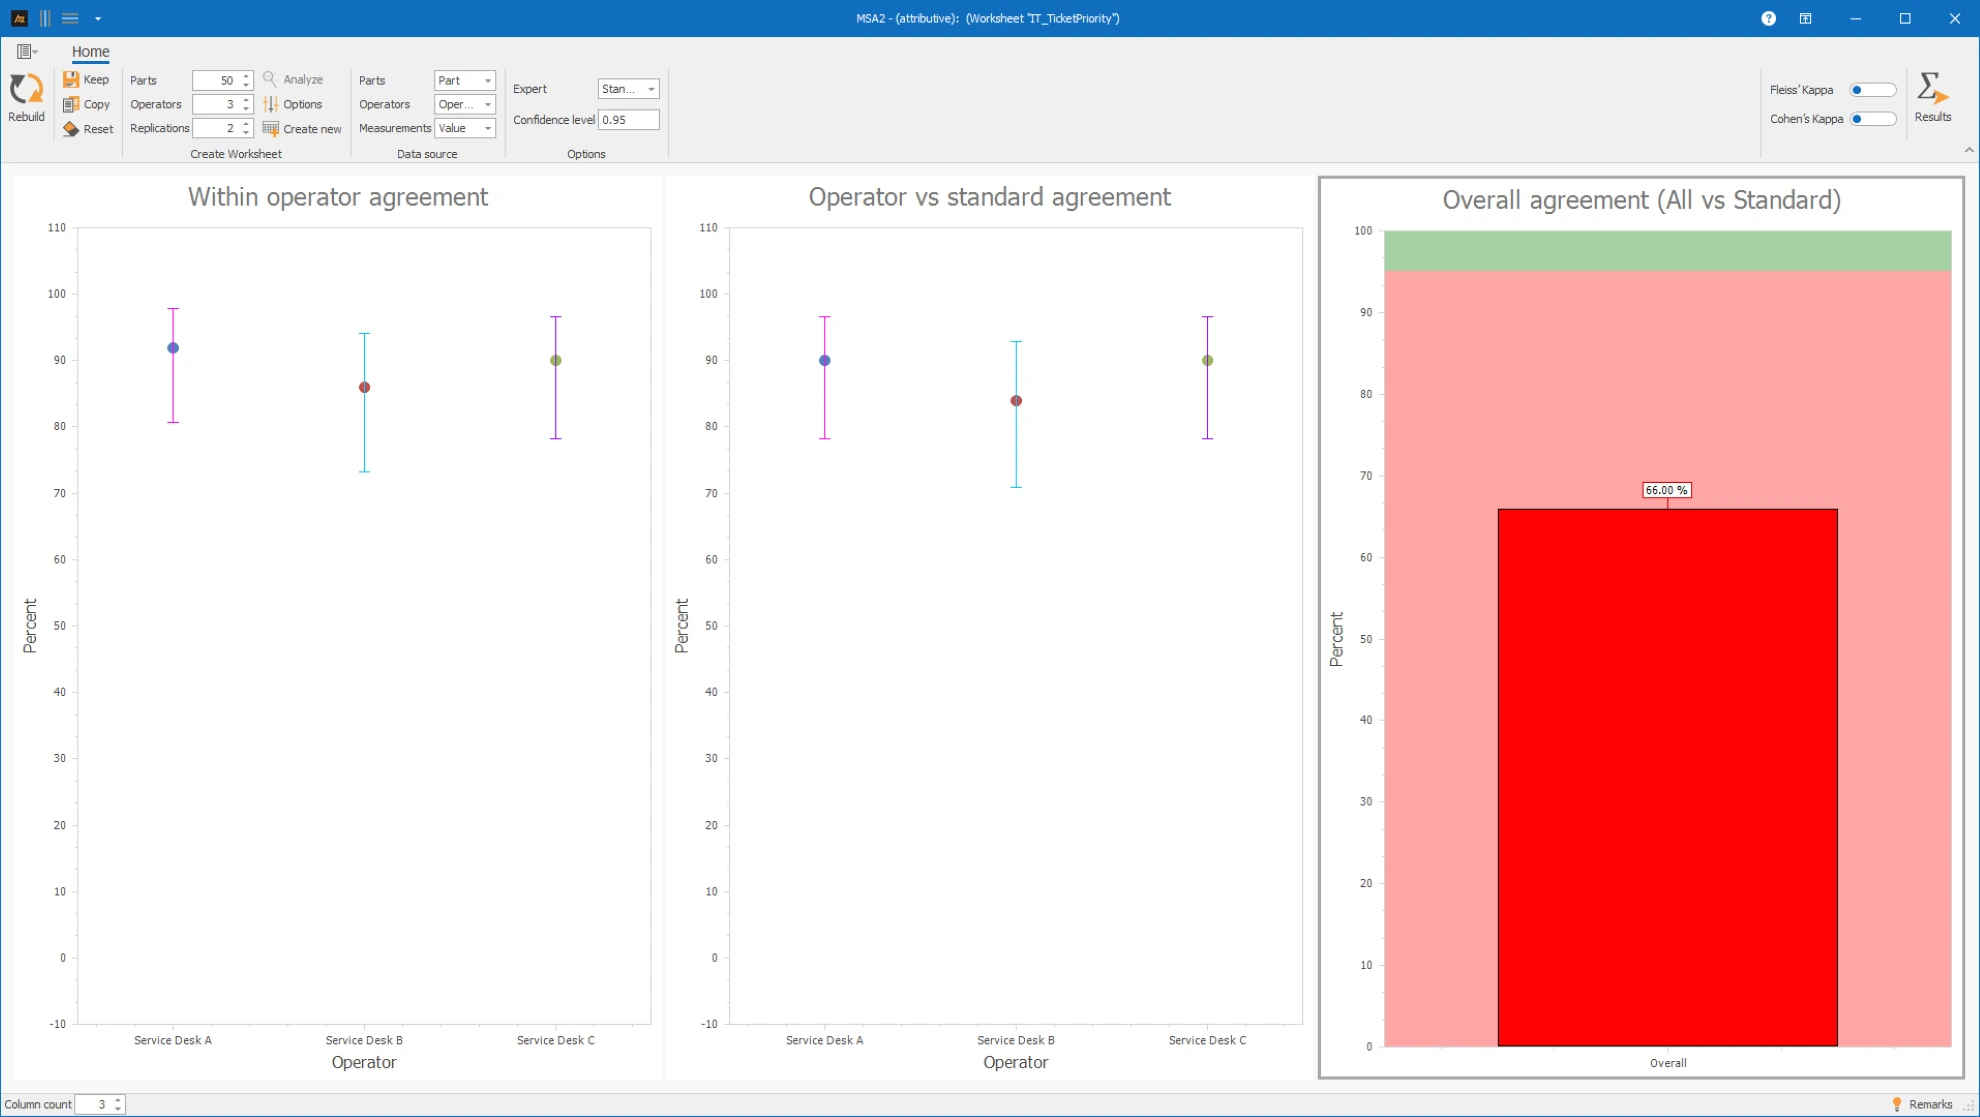
Interpretation:
The evaluation shows that employees can largely repeat their own classification. However, the agreement with the standard is too low for one reviewer.
This means: The reviewer evaluates relatively consistently but does not assign some tickets to the technically correct category.
As a measure, the decision criteria for the ticket types should be sharpened and typical borderline cases included in the work instructions.
Assessment of Lead Quality
In sales, incoming leads are evaluated by several sales representatives. It should be checked whether the employees classify the same leads uniformly according to their lead quality.
The evaluation is carried out in three classes:
| Condition | Meaning |
|---|---|
| Hot | Specific need, high probability of purchase, budget or decision proximity recognizable |
| Warm | Interest present, but need, budget or timing not yet clearly clarified |
| Cold | No specific need, low fit or currently no recognizable purchase intention |
For the MSA Type 2 attributive, three sales representatives each evaluate the same leads twice. Additionally, a sales manager sets a reference evaluation as a standard for each lead.
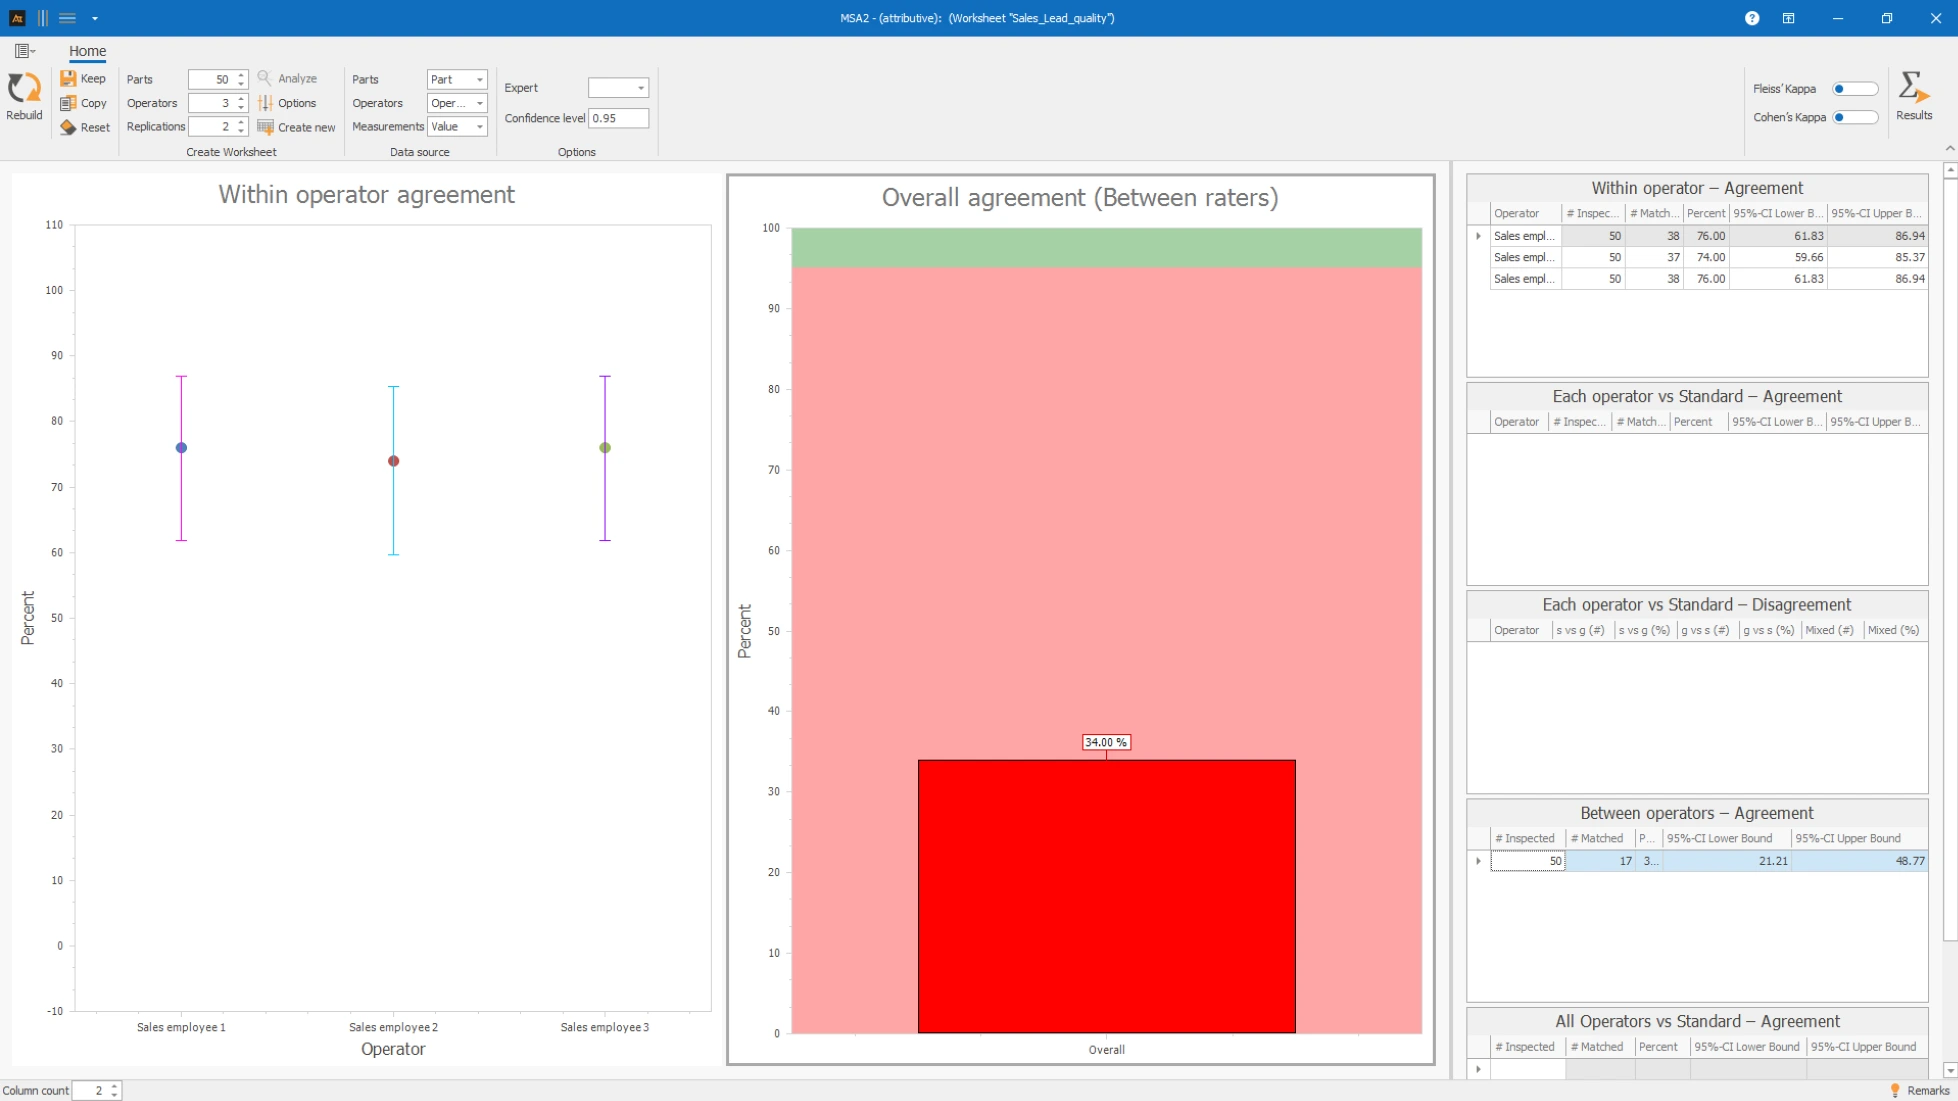
Interpretation:
The MSA Type 2 attributive shows whether the lead evaluation is consistent and repeatable.
A high agreement among the sales representatives means that the employees can consistently repeat their own evaluation. A high agreement with the standard shows that the classification as Hot, Warm, or Cold is also technically correct.
In case of low agreement, the criteria for the three lead classes should be described in more detail. Especially with Warm leads, borderline cases can occur, as interest is present, but need, budget, or timing are still unclear.
Picking Inspection in the Logistics Center
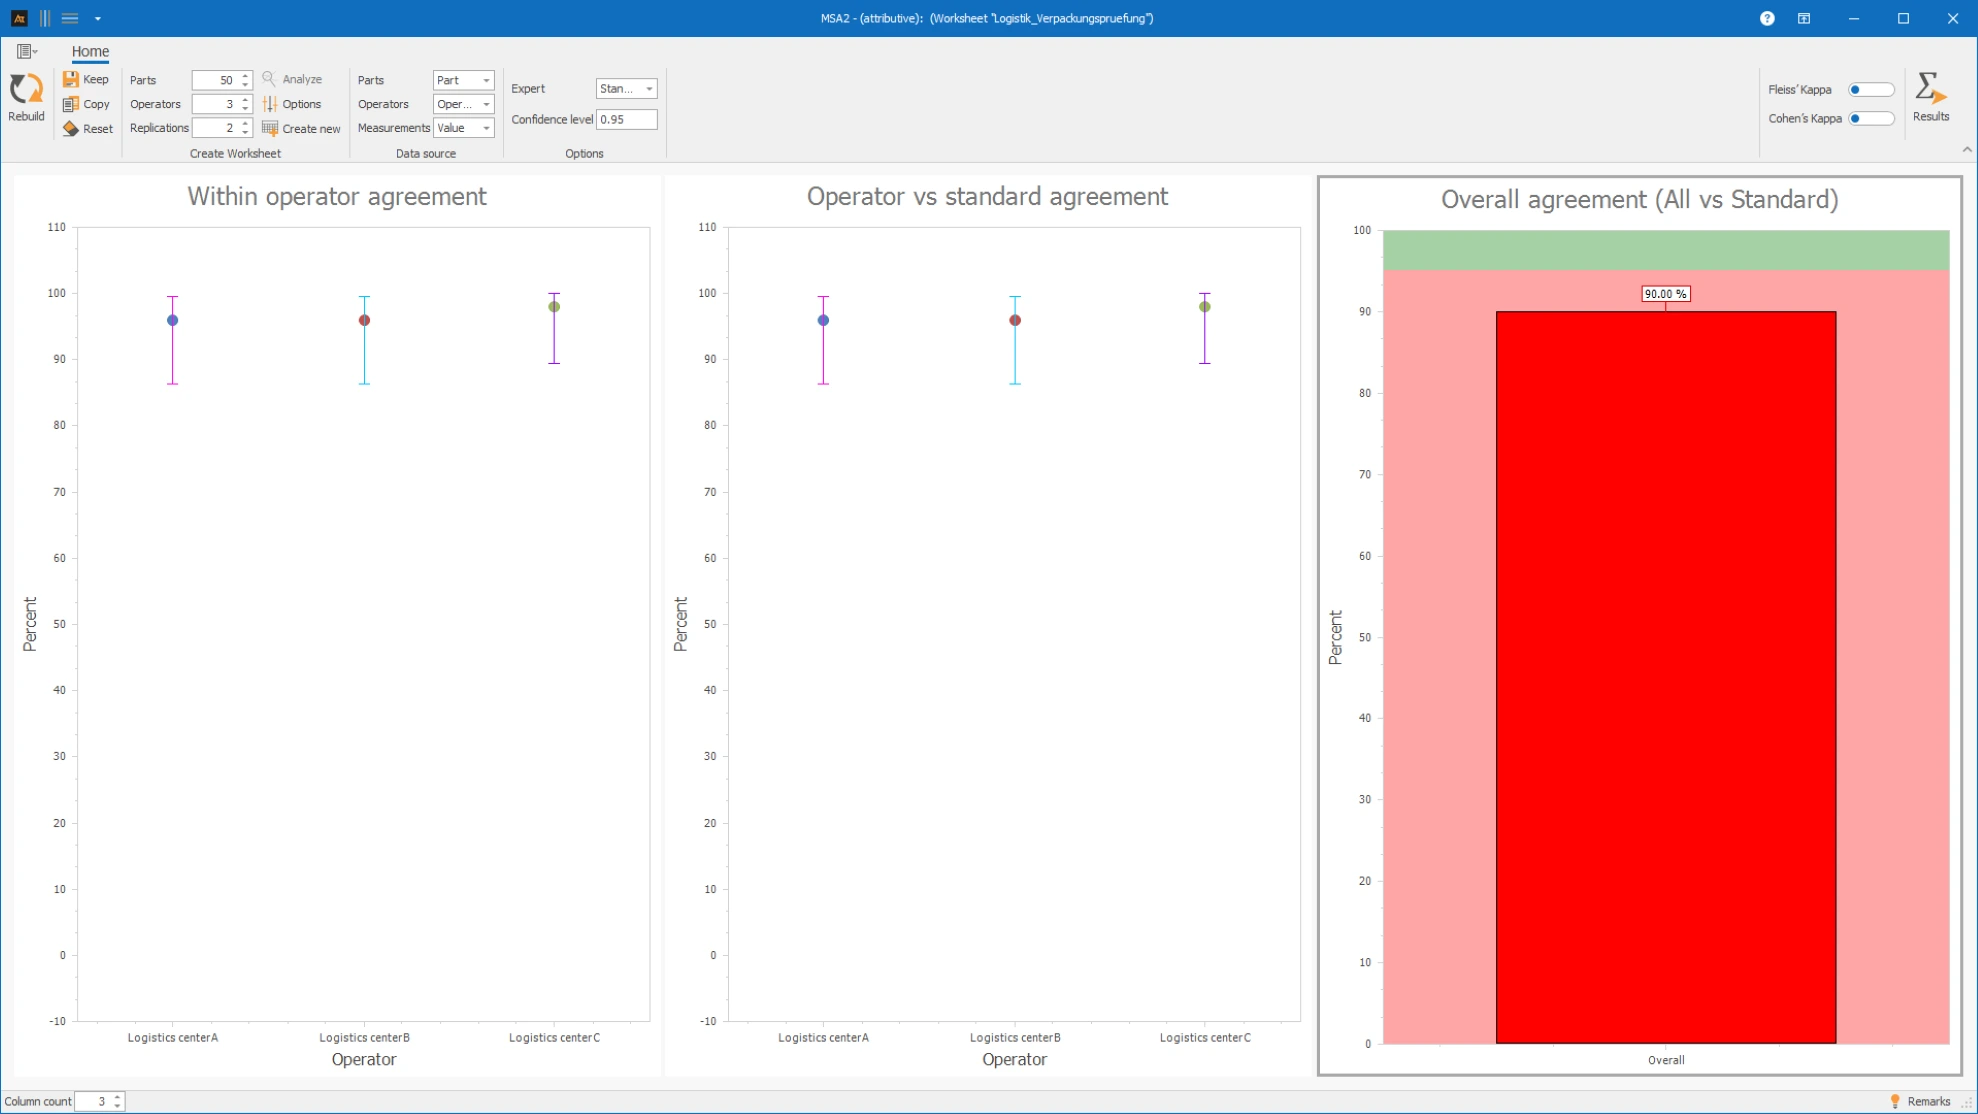
In logistics, customer orders are checked after picking. The inspectors assess whether an order is o.k. or n.o.k. An order is n.o.k. if an item has visible damage.
Several inspectors evaluate the same prepared orders twice each. A standard is set by a preliminary reference inspection.
Interpretation:
The overall agreement of all inspectors with the standard is below 95%. Therefore, the traffic light is red.
The detailed table shows that g vs s deviations occur in particular. This means that faulty orders are sometimes rated as good.
This type of deviation is critical because faulty shipments can reach the customer. Before further use of the inspection data, the inspection instructions, checklist, and training should be improved.
Incoming Goods Inspection of Supplier Parts
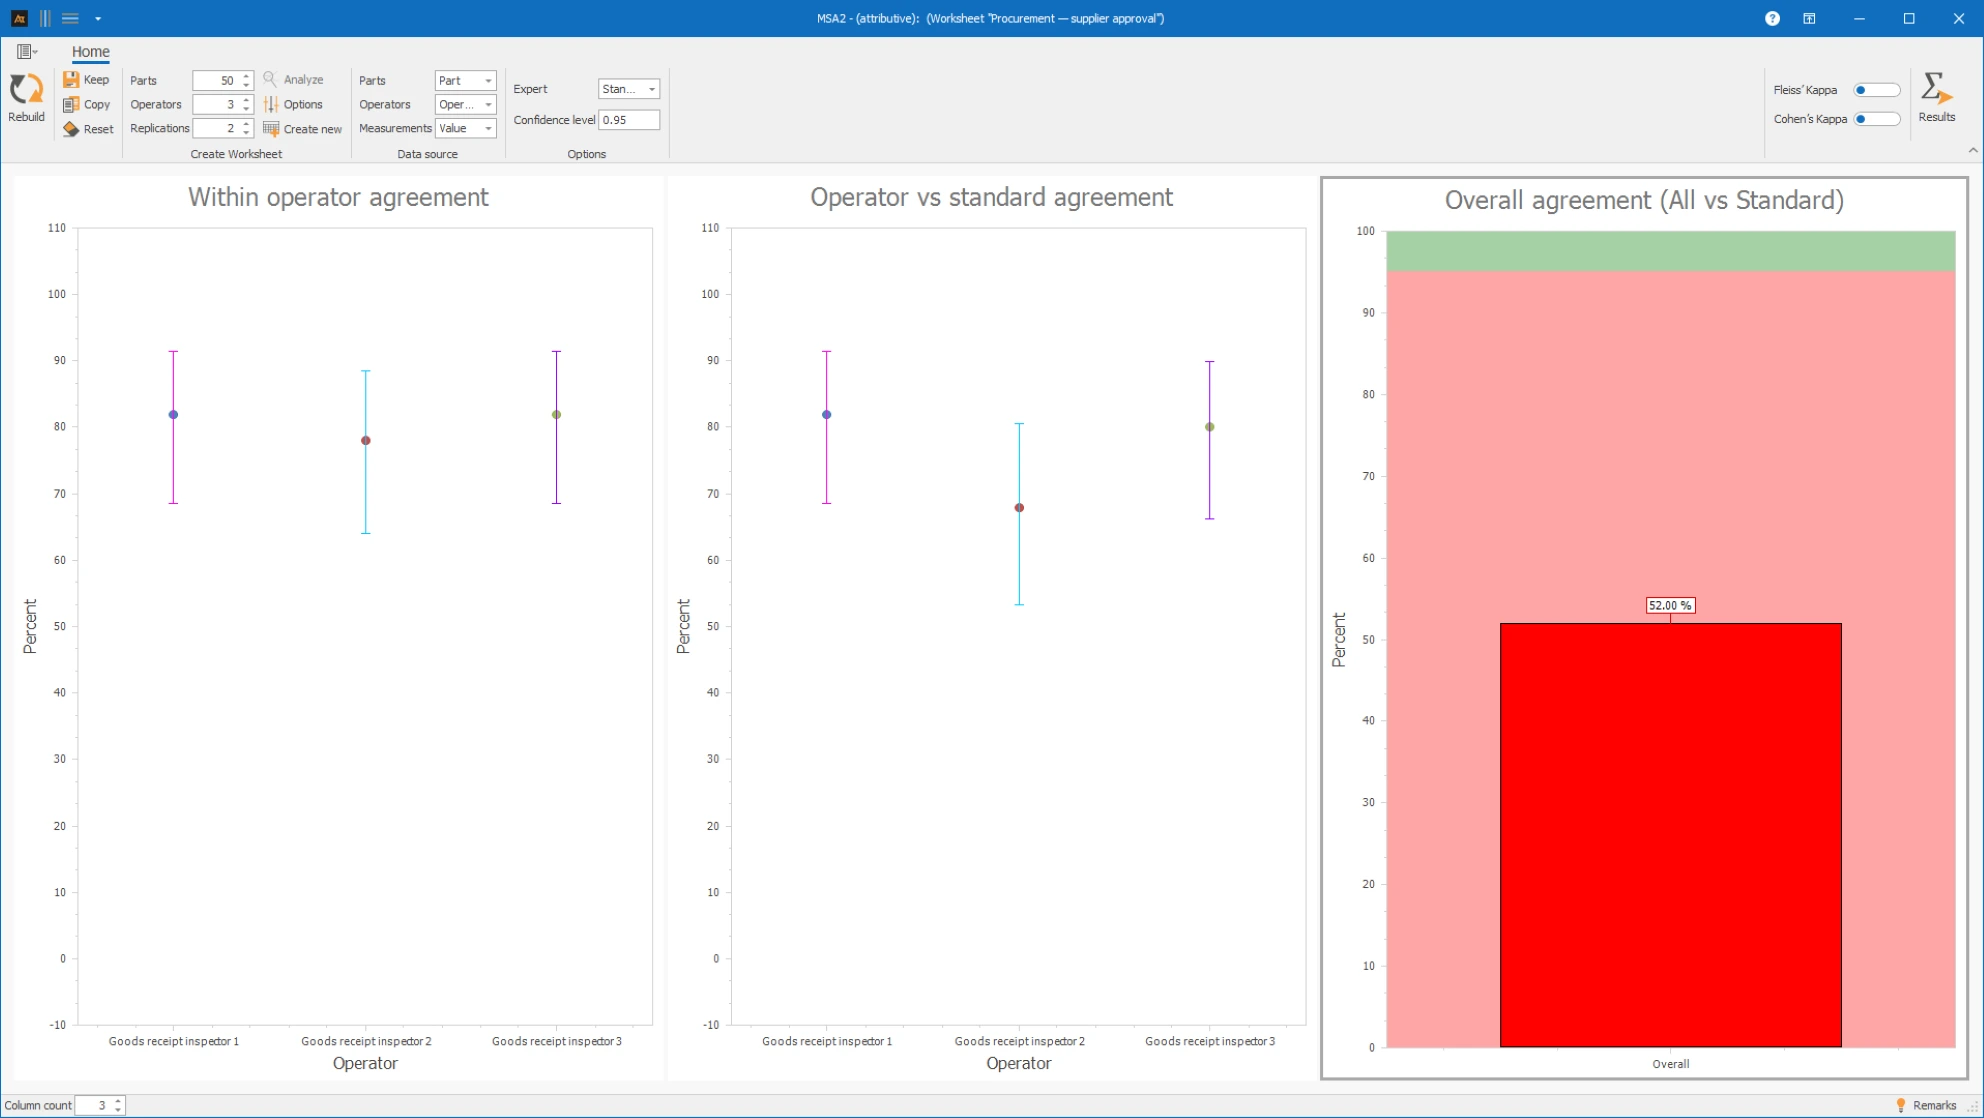
In purchasing or incoming goods, components from several suppliers are visually and functionally evaluated. The inspectors decide whether a part is accepted or blocked.
For MSA Type 2 attribute, parts with known defect patterns and defect-free parts are selected. The standard evaluation is determined by quality assurance and the technical department.
Interpretation:
The inspectors show good repeatability, but the agreement with the standard is too low for one inspector.
The table Each operator vs Standard – Disagreement shows that good parts were repeatedly rated as bad.
This deviation usually does not directly lead to a customer risk, but it can cause unnecessary blockages, re-inspections, and supplier complaints.
As a measure, limit samples and defect patterns should be discussed and calibrated with the inspectors.
Evaluation of Forecast Deviations
In production planning, forecasts are evaluated retrospectively. Planners assign each case to a traffic light class:
- green = acceptable deviation
- yellow = critical
- red = not acceptable
Since this evaluation is carried out by people, it should be checked whether the planners classify the cases consistently. A standard can be established through fixed thresholds or by an expert panel.

Interpretation:
The MSA shows that clear green and red cases are largely evaluated consistently. However, deviations occur more frequently in yellow borderline cases.
The traffic light logic should therefore be specified, for example, through clear thresholds and additional examples for borderline cases. Subsequently, the MSA should be repeated.
The MSA Type 2 attributive is mainly based on proportions of agreement and on kappa statistics.
The confidence intervals output in AlphadiTab show the uncertainty of the estimated agreement proportions. For small samples or unbalanced distribution of categories, the intervals become wider.